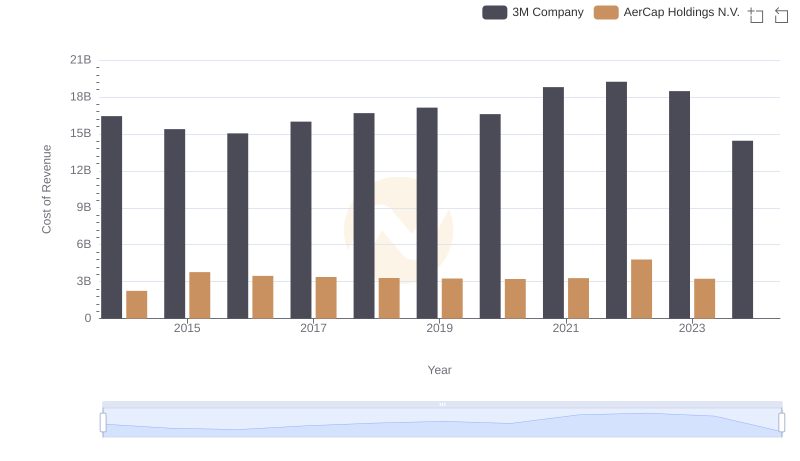
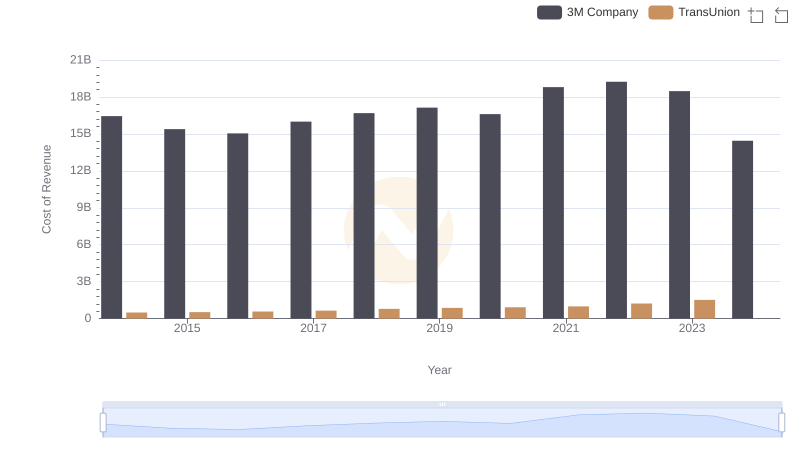
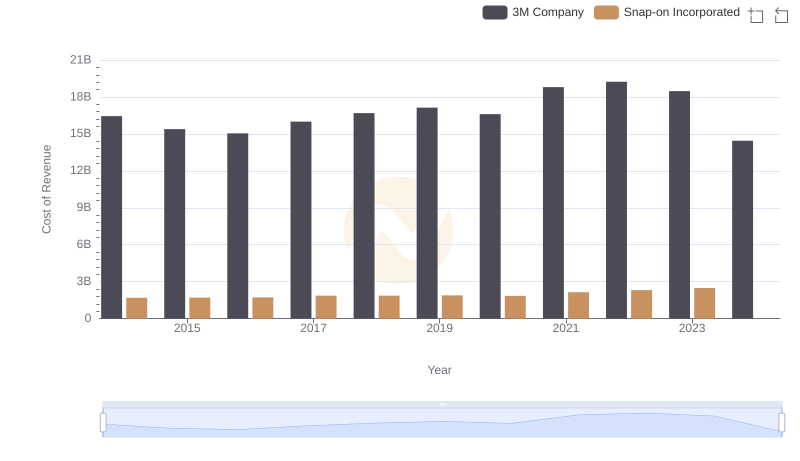
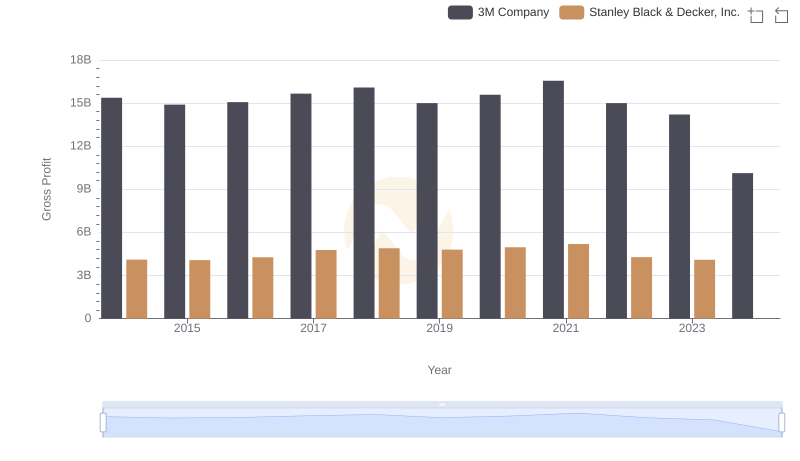
| __timestamp | 3M Company | Stanley Black & Decker, Inc. |
|---|---|---|
| Wednesday, January 1, 2014 | 16447000000 | 7235900000 |
| Thursday, January 1, 2015 | 15383000000 | 7099800000 |
| Friday, January 1, 2016 | 15040000000 | 7139700000 |
| Sunday, January 1, 2017 | 16001000000 | 7969200000 |
| Monday, January 1, 2018 | 16682000000 | 9080500000 |
| Tuesday, January 1, 2019 | 17136000000 | 9636700000 |
| Wednesday, January 1, 2020 | 16605000000 | 9566700000 |
| Friday, January 1, 2021 | 18795000000 | 10423000000 |
| Saturday, January 1, 2022 | 19232000000 | 12663300000 |
| Sunday, January 1, 2023 | 18477000000 | 11683100000 |
| Monday, January 1, 2024 | 14447000000 | 10851300000 |
Unleashing insights
In the competitive landscape of industrial giants, cost efficiency is a critical metric. Over the past decade, 3M Company and Stanley Black & Decker, Inc. have showcased distinct trends in their cost of revenue. From 2014 to 2023, 3M consistently maintained a higher cost of revenue, peaking in 2022 with a 17% increase from 2014. Meanwhile, Stanley Black & Decker saw a significant rise, with a 75% increase over the same period, indicating aggressive expansion or increased operational costs.
Interestingly, 3M's cost of revenue saw a decline in 2023, dropping by 4% from the previous year, while Stanley Black & Decker's data for 2024 remains unavailable, leaving room for speculation. This analysis provides a window into the operational strategies of these industry leaders, highlighting the importance of cost management in sustaining competitive advantage.