| __timestamp | 3M Company | TransUnion |
|---|---|---|
| Wednesday, January 1, 2014 | 16447000000 | 499100000 |
| Thursday, January 1, 2015 | 15383000000 | 531600000 |
| Friday, January 1, 2016 | 15040000000 | 579100000 |
| Sunday, January 1, 2017 | 16001000000 | 645700000 |
| Monday, January 1, 2018 | 16682000000 | 790100000 |
| Tuesday, January 1, 2019 | 17136000000 | 874100000 |
| Wednesday, January 1, 2020 | 16605000000 | 920400000 |
| Friday, January 1, 2021 | 18795000000 | 991600000 |
| Saturday, January 1, 2022 | 19232000000 | 1222900000 |
| Sunday, January 1, 2023 | 18477000000 | 1517300000 |
| Monday, January 1, 2024 | 14447000000 | 0 |
Unleashing the power of data
In the ever-evolving landscape of corporate finance, understanding the cost of revenue is crucial for assessing a company's efficiency. From 2014 to 2023, 3M Company and TransUnion have shown distinct trends in their cost of revenue. 3M's cost of revenue peaked in 2022, reaching approximately 15% higher than its 2014 value, before slightly declining in 2023. In contrast, TransUnion's cost of revenue has seen a remarkable increase of over 200% from 2014 to 2023, reflecting its aggressive growth strategy. Notably, data for 2024 is incomplete, highlighting the dynamic nature of financial reporting. This analysis provides a window into how these companies manage their production costs relative to their revenue, offering insights into their operational strategies and market positioning.
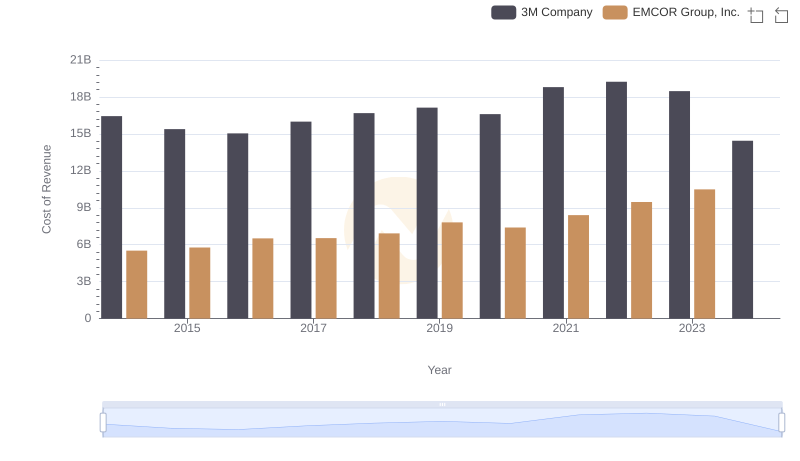
3M Company vs EMCOR Group, Inc.: Efficiency in Cost of Revenue Explored

Cost of Revenue Trends: 3M Company vs Watsco, Inc.
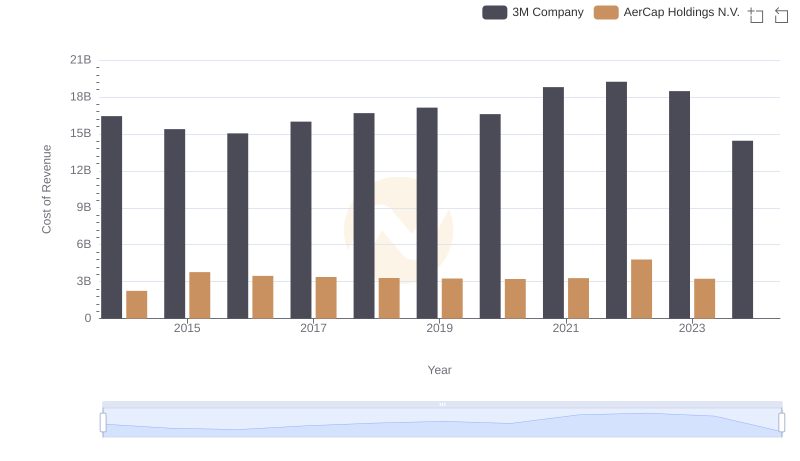
3M Company vs AerCap Holdings N.V.: Efficiency in Cost of Revenue Explored
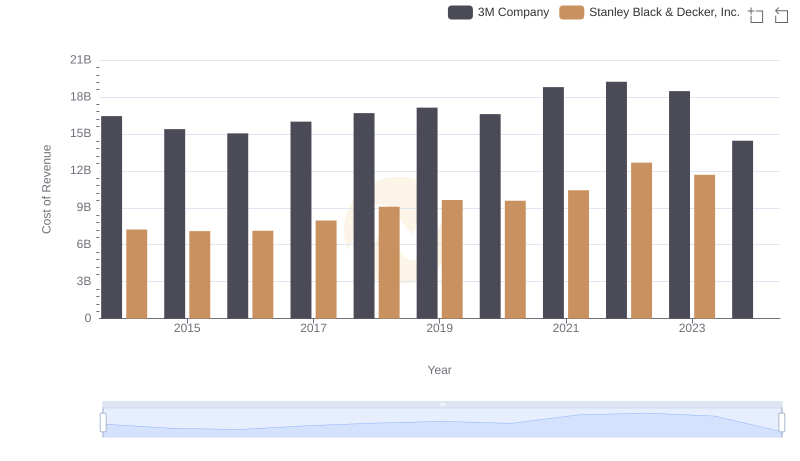
3M Company vs Stanley Black & Decker, Inc.: Efficiency in Cost of Revenue Explored
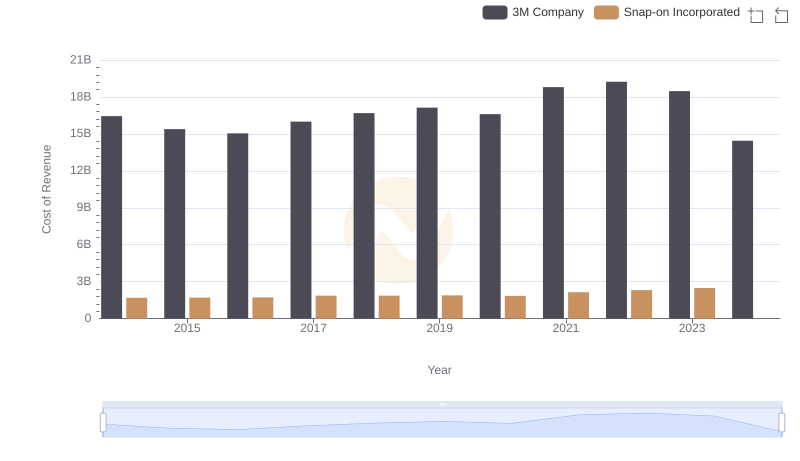
Cost of Revenue Comparison: 3M Company vs Snap-on Incorporated
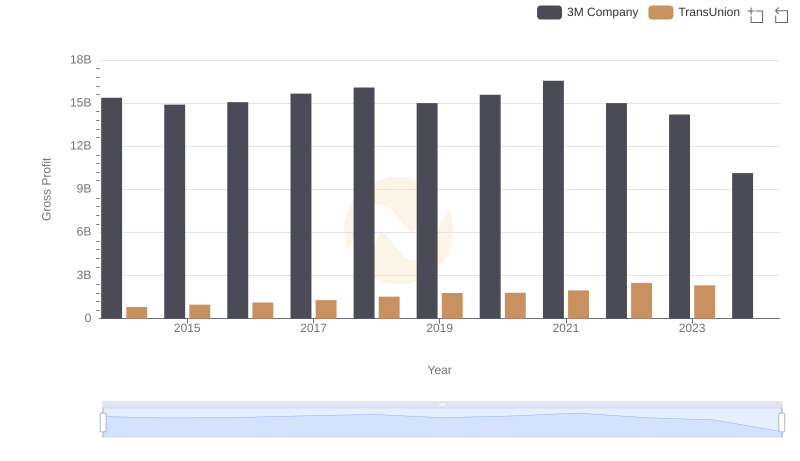
3M Company and TransUnion: A Detailed Gross Profit Analysis
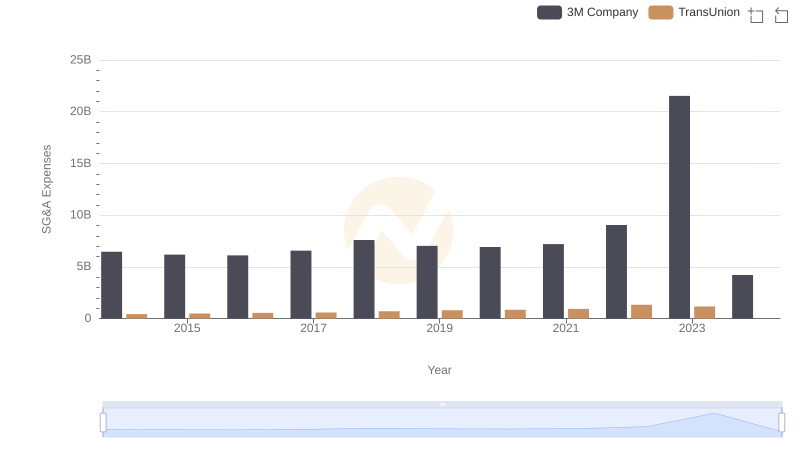
3M Company vs TransUnion: SG&A Expense Trends