| __timestamp | United Airlines Holdings, Inc. | Westinghouse Air Brake Technologies Corporation |
|---|---|---|
| Wednesday, January 1, 2014 | 29569000000 | 2130920000 |
| Thursday, January 1, 2015 | 25952000000 | 2281845000 |
| Friday, January 1, 2016 | 24856000000 | 2029647000 |
| Sunday, January 1, 2017 | 27056000000 | 2841159000 |
| Monday, January 1, 2018 | 30165000000 | 3151816000 |
| Tuesday, January 1, 2019 | 30786000000 | 6122400000 |
| Wednesday, January 1, 2020 | 20385000000 | 5657400000 |
| Friday, January 1, 2021 | 23913000000 | 5687000000 |
| Saturday, January 1, 2022 | 34315000000 | 6070000000 |
| Sunday, January 1, 2023 | 38518000000 | 6733000000 |
| Monday, January 1, 2024 | 37643000000 | 7021000000 |
In pursuit of knowledge
In the ever-evolving landscape of American industry, the cost of revenue serves as a critical indicator of operational efficiency and market dynamics. This analysis delves into the financial trajectories of two giants: United Airlines Holdings, Inc. and Westinghouse Air Brake Technologies Corporation, from 2014 to 2023.
United Airlines, a leader in the aviation sector, experienced a notable fluctuation in its cost of revenue. Starting at approximately $29.6 billion in 2014, it dipped to $20.4 billion in 2020, reflecting the pandemic's impact. However, by 2023, it rebounded to $38.5 billion, marking a 30% increase from its 2014 figures.
Conversely, Westinghouse Air Brake Technologies, a key player in the rail industry, saw a steady rise. From $2.1 billion in 2014, its cost of revenue more than tripled to $6.7 billion by 2023, highlighting robust growth and strategic expansion.
These trends underscore the resilience and adaptability of these industries in the face of economic challenges.
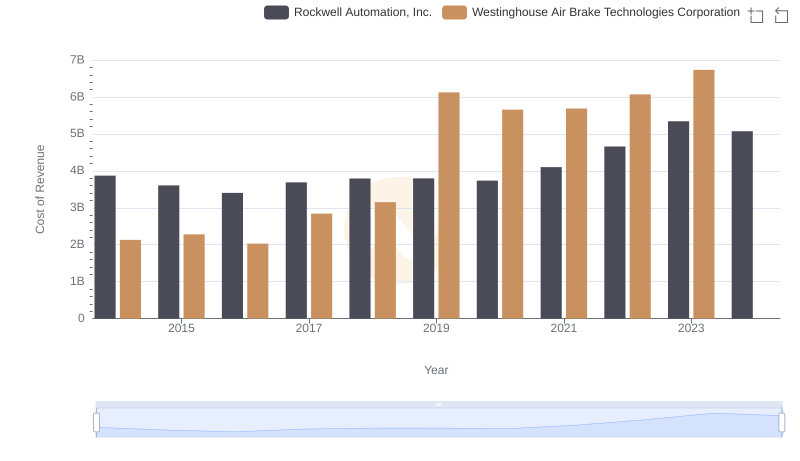
Westinghouse Air Brake Technologies Corporation vs Rockwell Automation, Inc.: Efficiency in Cost of Revenue Explored
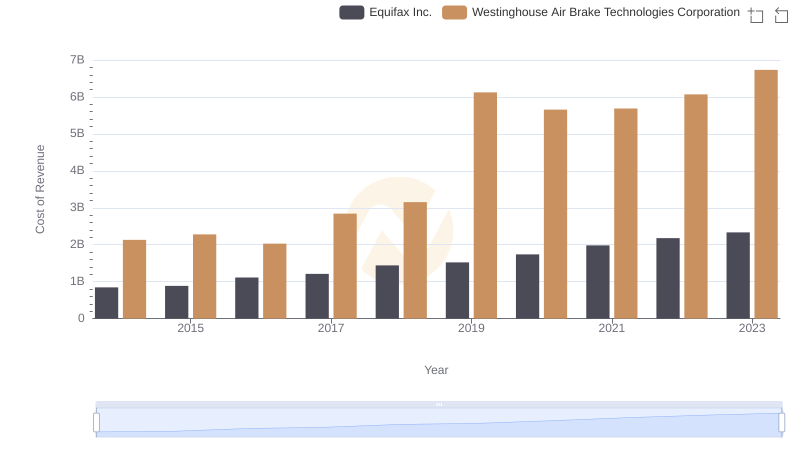
Westinghouse Air Brake Technologies Corporation vs Equifax Inc.: Efficiency in Cost of Revenue Explored
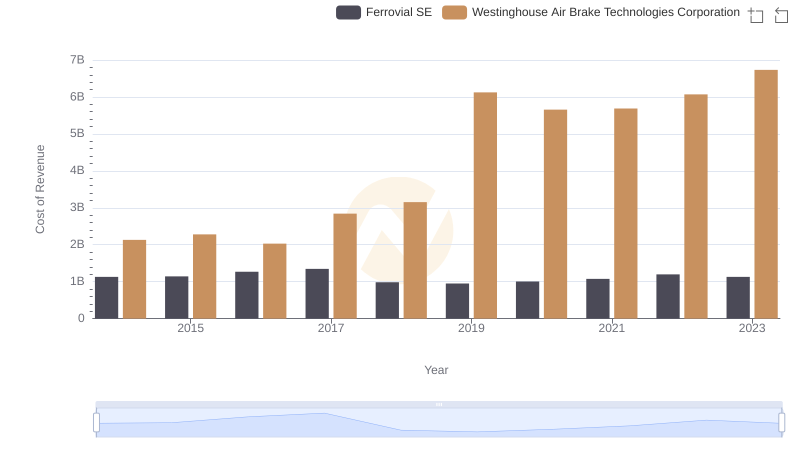
Comparing Cost of Revenue Efficiency: Westinghouse Air Brake Technologies Corporation vs Ferrovial SE

Cost of Revenue Trends: Westinghouse Air Brake Technologies Corporation vs Global Payments Inc.
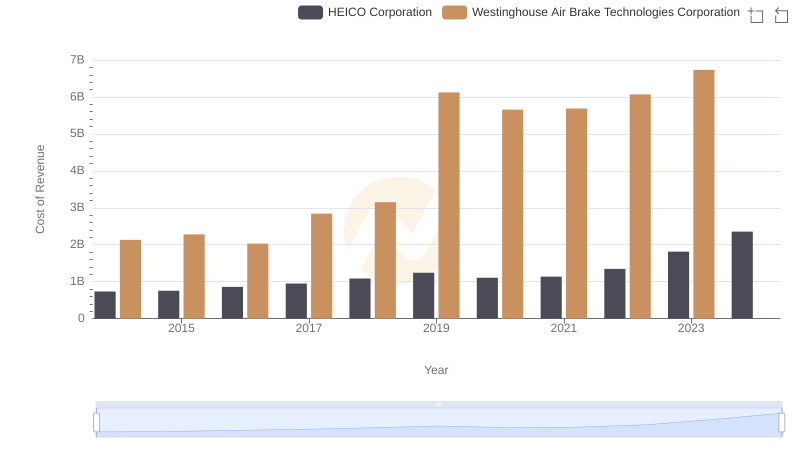
Westinghouse Air Brake Technologies Corporation vs HEICO Corporation: Efficiency in Cost of Revenue Explored
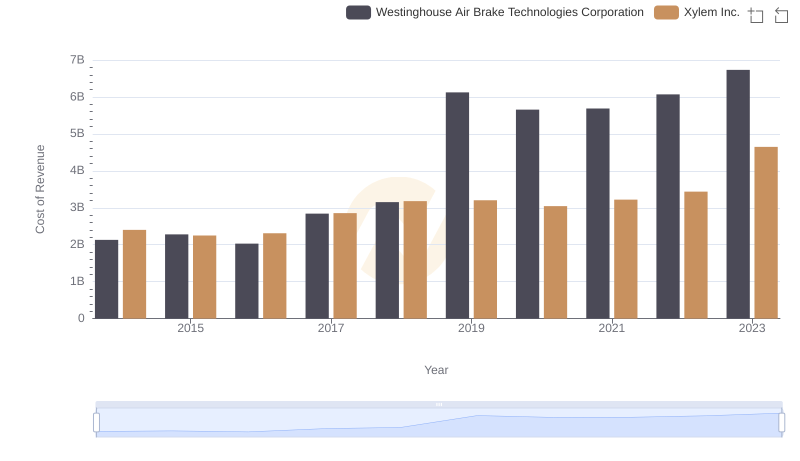
Cost Insights: Breaking Down Westinghouse Air Brake Technologies Corporation and Xylem Inc.'s Expenses
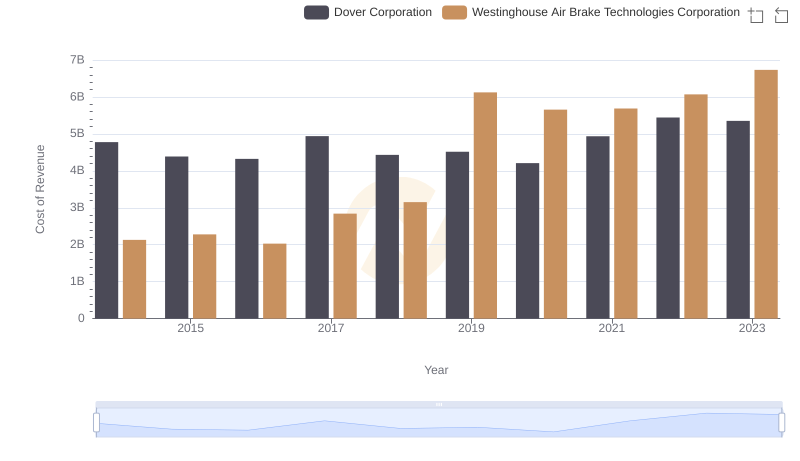
Cost Insights: Breaking Down Westinghouse Air Brake Technologies Corporation and Dover Corporation's Expenses
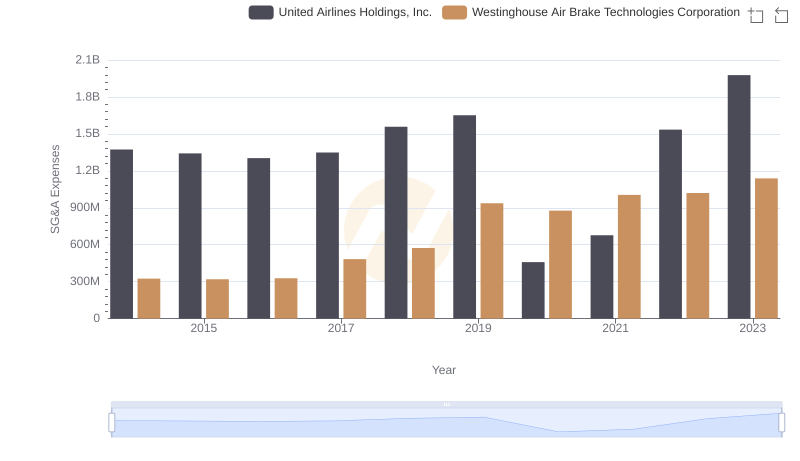
Operational Costs Compared: SG&A Analysis of Westinghouse Air Brake Technologies Corporation and United Airlines Holdings, Inc.
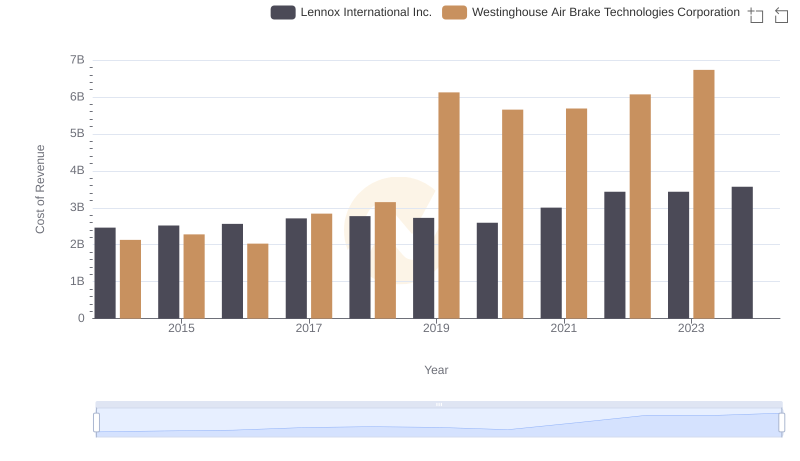
Westinghouse Air Brake Technologies Corporation vs Lennox International Inc.: Efficiency in Cost of Revenue Explored