| __timestamp | ITT Inc. | Westinghouse Air Brake Technologies Corporation |
|---|---|---|
| Wednesday, January 1, 2014 | 2654600000 | 3044454000 |
| Thursday, January 1, 2015 | 2485600000 | 3307998000 |
| Friday, January 1, 2016 | 2405400000 | 2931188000 |
| Sunday, January 1, 2017 | 2585300000 | 3881756000 |
| Monday, January 1, 2018 | 2745100000 | 4363547000 |
| Tuesday, January 1, 2019 | 2846400000 | 8200000000 |
| Wednesday, January 1, 2020 | 2477800000 | 7556100000 |
| Friday, January 1, 2021 | 2765000000 | 7822000000 |
| Saturday, January 1, 2022 | 2987700000 | 8362000000 |
| Sunday, January 1, 2023 | 3283000000 | 9677000000 |
| Monday, January 1, 2024 | 3630700000 | 10387000000 |
Cracking the code
In the competitive landscape of industrial technology, Westinghouse Air Brake Technologies Corporation and ITT Inc. have showcased remarkable revenue trajectories over the past decade. From 2014 to 2023, Westinghouse Air Brake Technologies Corporation has seen its revenue soar by over 218%, reaching a peak in 2023. This growth reflects the company's strategic expansions and innovations in the rail and transit sectors. Meanwhile, ITT Inc. has experienced a steady revenue increase of approximately 24% during the same period, underscoring its resilience and adaptability in the face of market challenges.
The data highlights a significant divergence in growth rates, with Westinghouse consistently outpacing ITT. This trend underscores the dynamic nature of the industrial sector and the varying strategies companies employ to capture market share. As we look to the future, these insights provide a window into the evolving landscape of industrial technology.
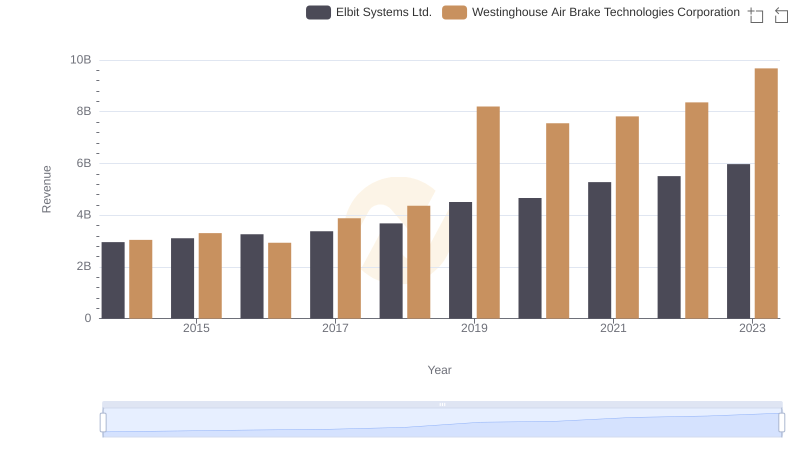
Westinghouse Air Brake Technologies Corporation and Elbit Systems Ltd.: A Comprehensive Revenue Analysis
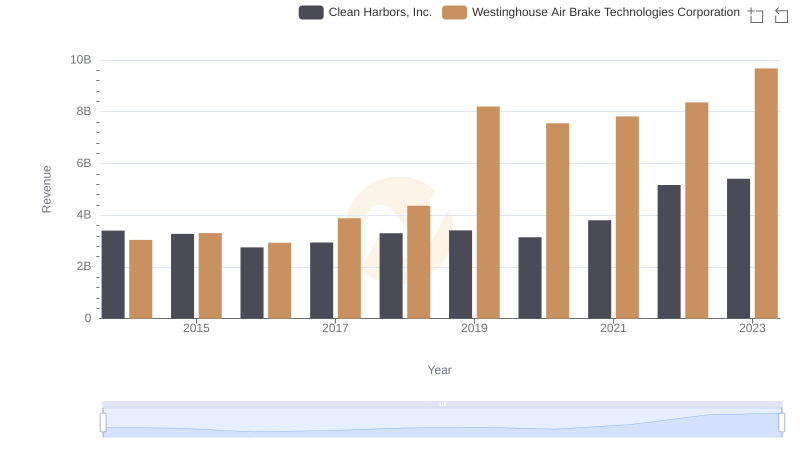
Annual Revenue Comparison: Westinghouse Air Brake Technologies Corporation vs Clean Harbors, Inc.
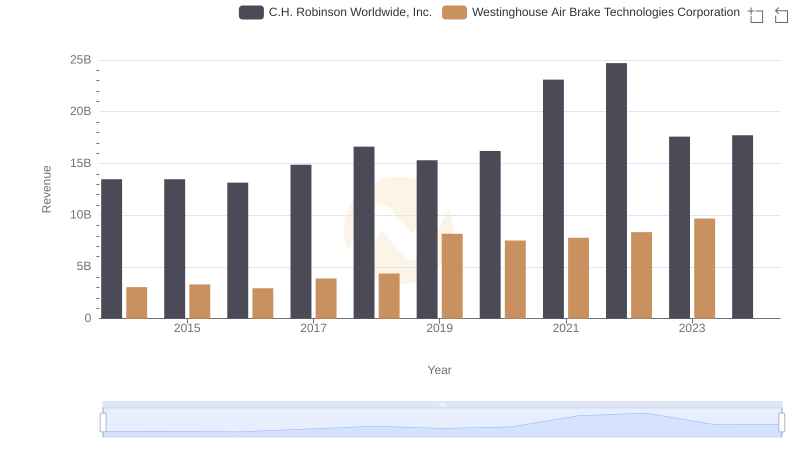
Breaking Down Revenue Trends: Westinghouse Air Brake Technologies Corporation vs C.H. Robinson Worldwide, Inc.
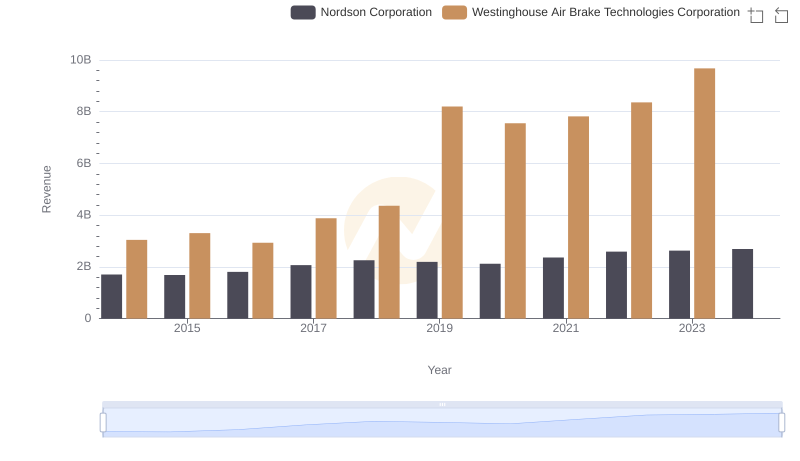
Annual Revenue Comparison: Westinghouse Air Brake Technologies Corporation vs Nordson Corporation
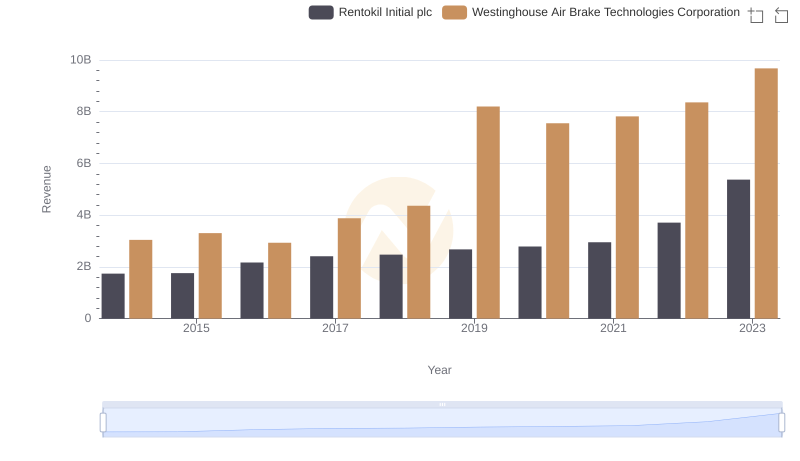
Revenue Insights: Westinghouse Air Brake Technologies Corporation and Rentokil Initial plc Performance Compared
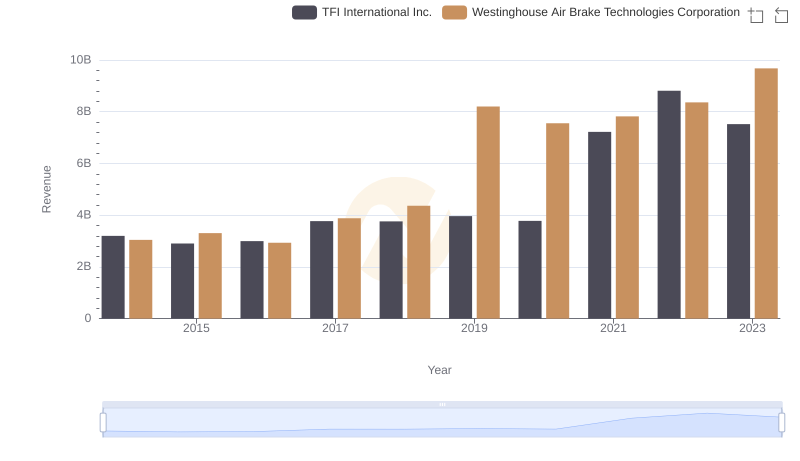
Westinghouse Air Brake Technologies Corporation or TFI International Inc.: Who Leads in Yearly Revenue?
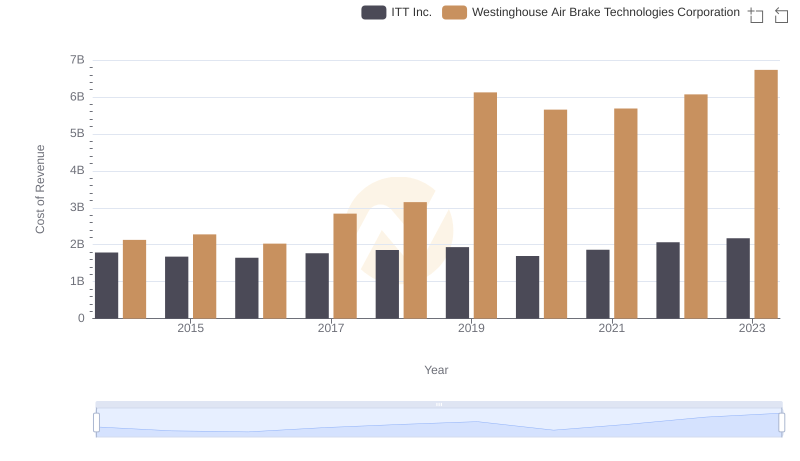
Cost of Revenue: Key Insights for Westinghouse Air Brake Technologies Corporation and ITT Inc.
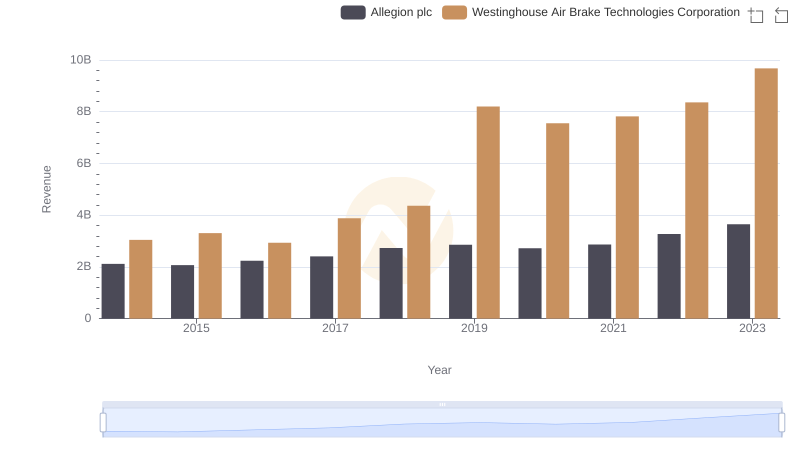
Annual Revenue Comparison: Westinghouse Air Brake Technologies Corporation vs Allegion plc
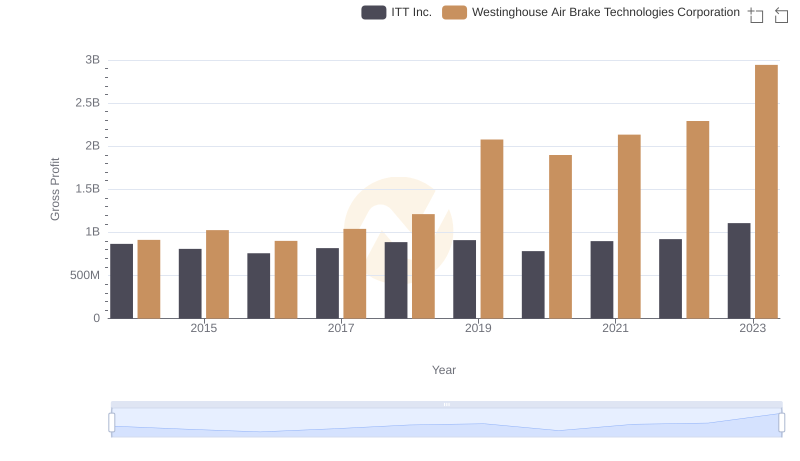
Gross Profit Analysis: Comparing Westinghouse Air Brake Technologies Corporation and ITT Inc.
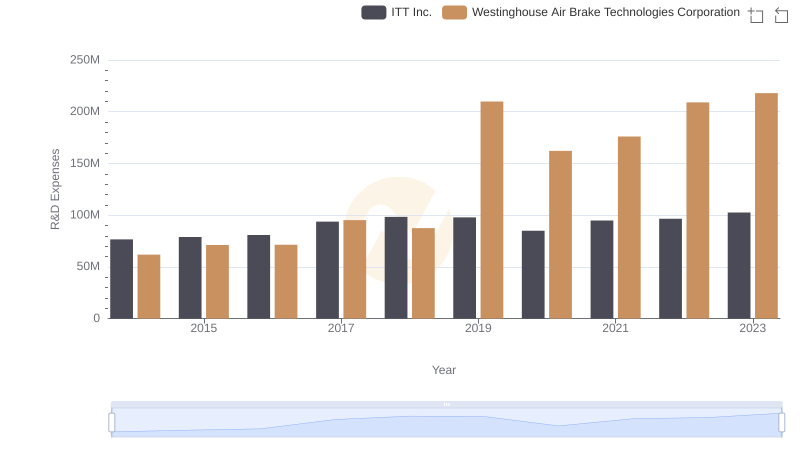
R&D Insights: How Westinghouse Air Brake Technologies Corporation and ITT Inc. Allocate Funds