| __timestamp | Ferguson plc | Waste Management, Inc. |
|---|---|---|
| Wednesday, January 1, 2014 | 15995739428 | 9002000000 |
| Thursday, January 1, 2015 | 14984241894 | 8231000000 |
| Friday, January 1, 2016 | 13677144858 | 8486000000 |
| Sunday, January 1, 2017 | 14215866673 | 9021000000 |
| Monday, January 1, 2018 | 14708000000 | 9249000000 |
| Tuesday, January 1, 2019 | 15552000000 | 9496000000 |
| Wednesday, January 1, 2020 | 15398000000 | 9341000000 |
| Friday, January 1, 2021 | 15812000000 | 11111000000 |
| Saturday, January 1, 2022 | 19810000000 | 12294000000 |
| Sunday, January 1, 2023 | 20709000000 | 12606000000 |
| Monday, January 1, 2024 | 20582000000 | 13383000000 |
Unleashing insights
In the ever-evolving landscape of global business, understanding the cost of revenue is crucial for evaluating a company's financial health. Waste Management, Inc. and Ferguson plc, two industry giants, have shown distinct trends over the past decade. From 2014 to 2023, Ferguson plc's cost of revenue increased by approximately 30%, peaking in 2023. Meanwhile, Waste Management, Inc. saw a 40% rise, with a notable jump in 2021. This upward trajectory highlights the growing operational expenses these companies face. Interestingly, data for 2024 is incomplete, suggesting potential shifts in the market. As businesses navigate economic challenges, these insights offer a glimpse into the strategic adjustments required to maintain profitability. Stay informed and explore how these trends could impact future business strategies.
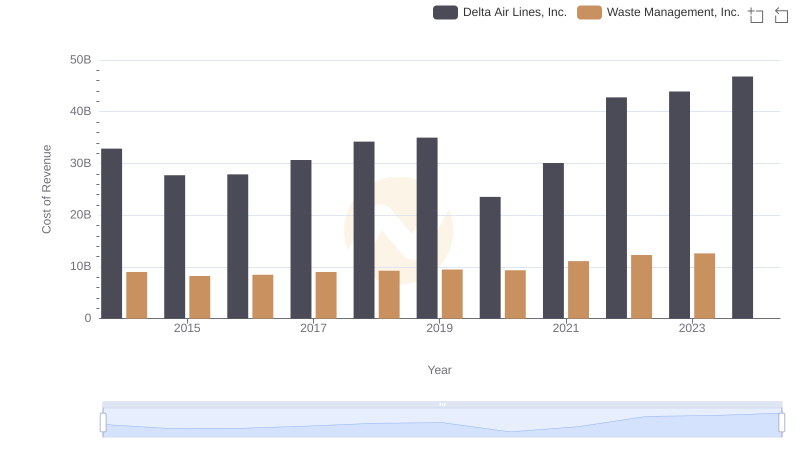
Cost of Revenue: Key Insights for Waste Management, Inc. and Delta Air Lines, Inc.
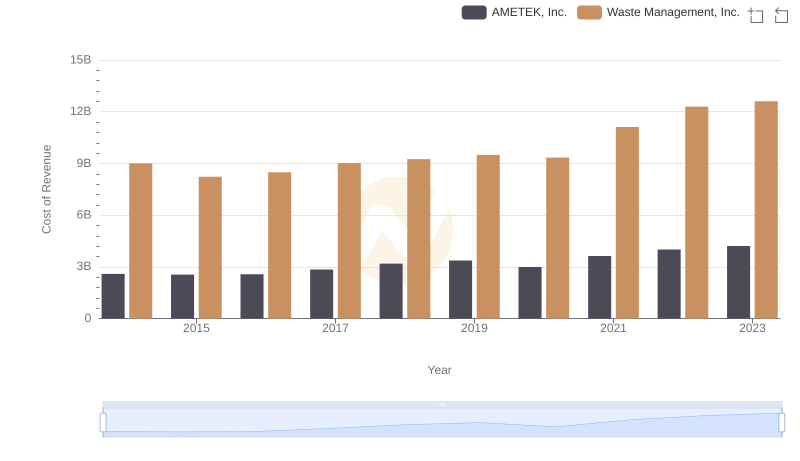
Waste Management, Inc. vs AMETEK, Inc.: Efficiency in Cost of Revenue Explored
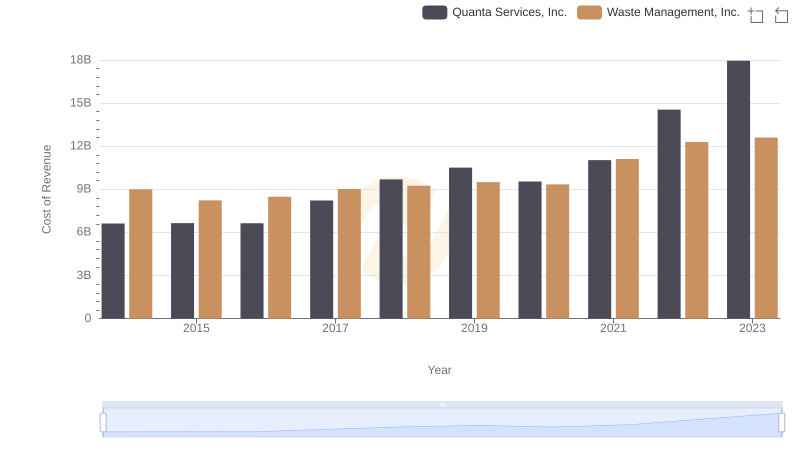
Cost of Revenue Comparison: Waste Management, Inc. vs Quanta Services, Inc.
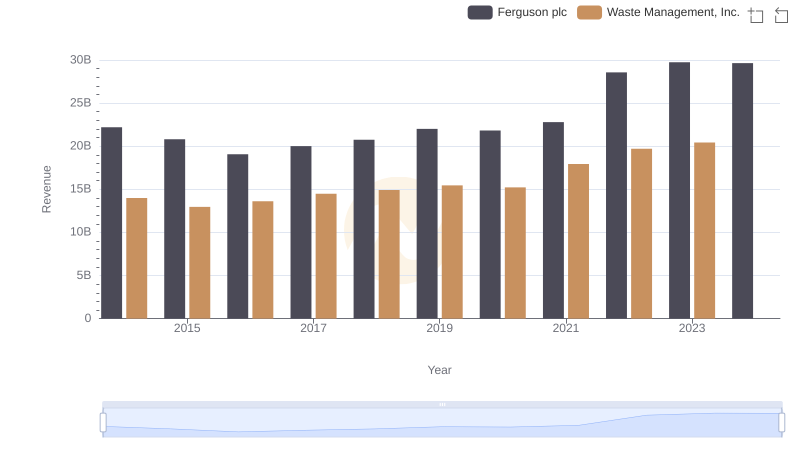
Revenue Insights: Waste Management, Inc. and Ferguson plc Performance Compared
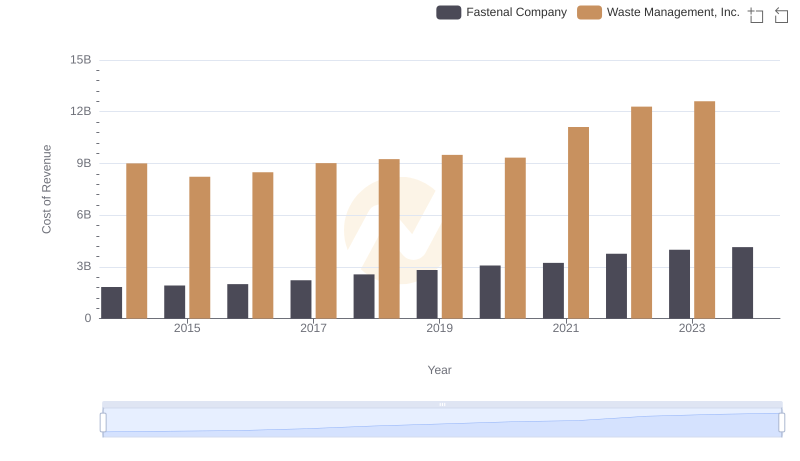
Comparing Cost of Revenue Efficiency: Waste Management, Inc. vs Fastenal Company
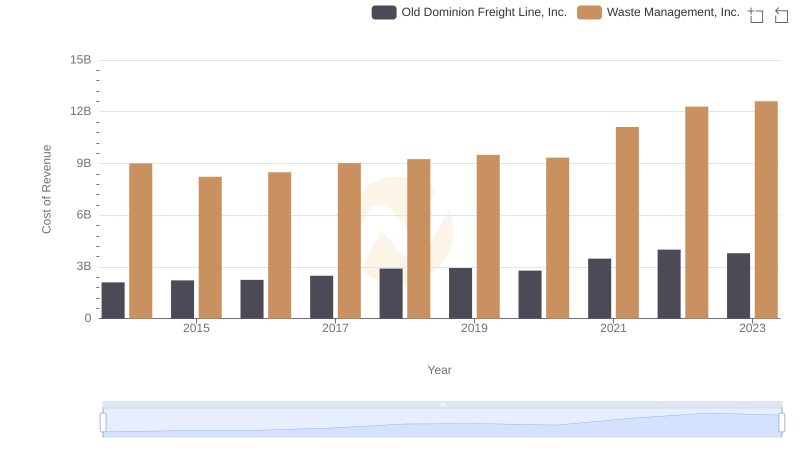
Cost of Revenue: Key Insights for Waste Management, Inc. and Old Dominion Freight Line, Inc.
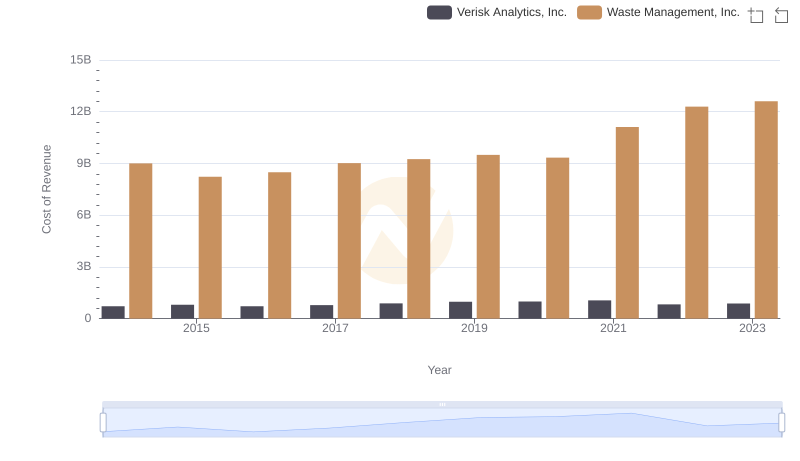
Comparing Cost of Revenue Efficiency: Waste Management, Inc. vs Verisk Analytics, Inc.
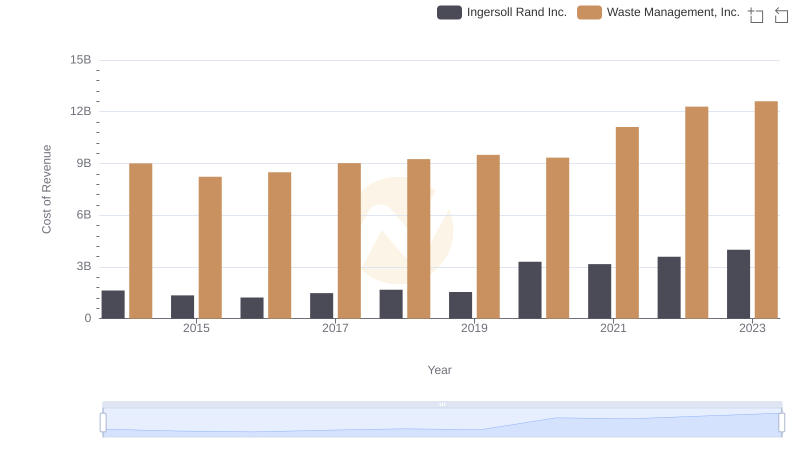
Cost of Revenue Comparison: Waste Management, Inc. vs Ingersoll Rand Inc.
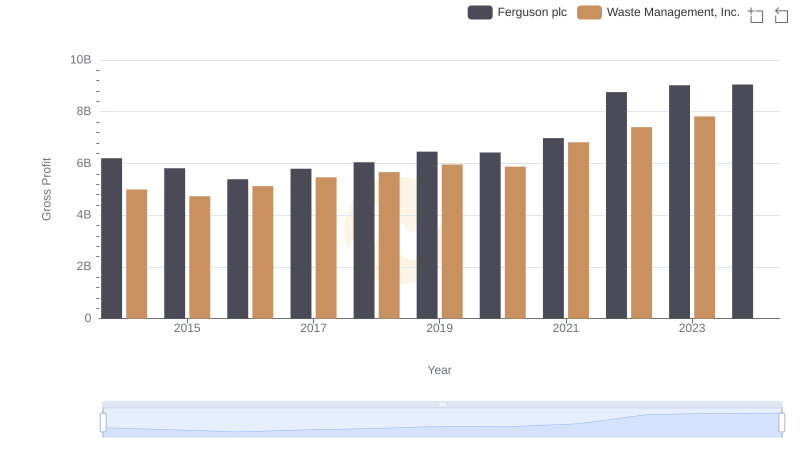
Gross Profit Trends Compared: Waste Management, Inc. vs Ferguson plc
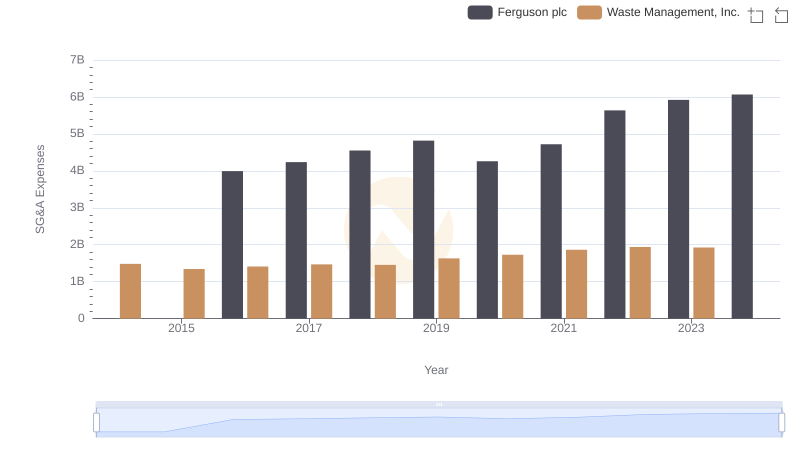
Breaking Down SG&A Expenses: Waste Management, Inc. vs Ferguson plc
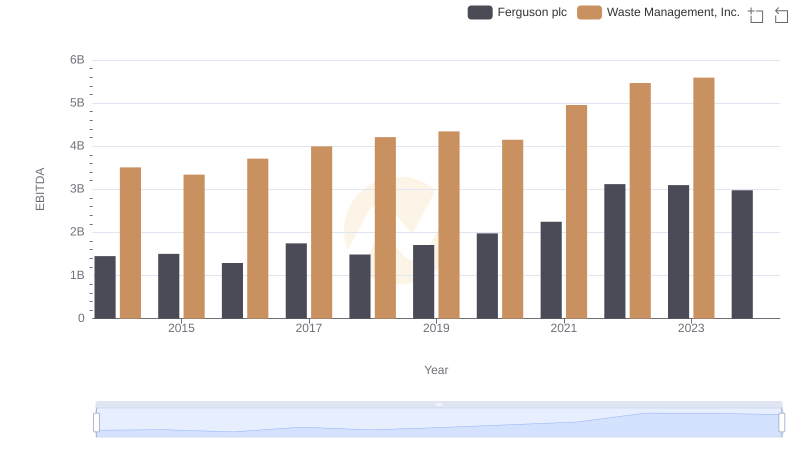
Waste Management, Inc. and Ferguson plc: A Detailed Examination of EBITDA Performance