| __timestamp | Ferguson plc | Waste Management, Inc. |
|---|---|---|
| Wednesday, January 1, 2014 | 22198928094 | 13996000000 |
| Thursday, January 1, 2015 | 20800698973 | 12961000000 |
| Friday, January 1, 2016 | 19066872795 | 13609000000 |
| Sunday, January 1, 2017 | 20009463224 | 14485000000 |
| Monday, January 1, 2018 | 20752000000 | 14914000000 |
| Tuesday, January 1, 2019 | 22010000000 | 15455000000 |
| Wednesday, January 1, 2020 | 21819000000 | 15218000000 |
| Friday, January 1, 2021 | 22792000000 | 17931000000 |
| Saturday, January 1, 2022 | 28566000000 | 19698000000 |
| Sunday, January 1, 2023 | 29734000000 | 20426000000 |
| Monday, January 1, 2024 | 29635000000 | 22063000000 |
Unleashing insights
In the ever-evolving landscape of global business, Waste Management, Inc. and Ferguson plc stand as titans in their respective industries. Over the past decade, these companies have demonstrated remarkable revenue trajectories. From 2014 to 2023, Ferguson plc's revenue surged by approximately 34%, showcasing its robust growth strategy. Meanwhile, Waste Management, Inc. experienced a steady increase of around 46% in the same period, reflecting its stronghold in the waste management sector.
Ferguson plc's revenue peaked in 2023, reaching nearly 30 billion, while Waste Management, Inc. saw its highest revenue in the same year, just over 20 billion. Notably, 2024 data for Waste Management, Inc. is missing, leaving room for speculation on its future performance. This comparison highlights the dynamic nature of these industries and the strategic maneuvers that drive their success.
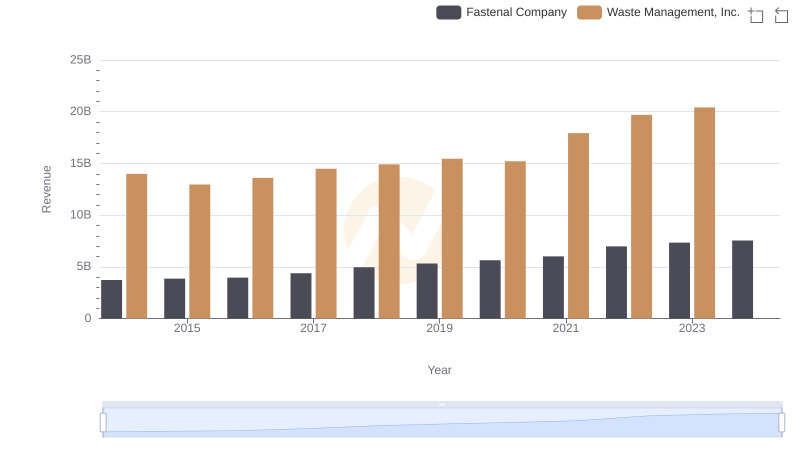
Waste Management, Inc. vs Fastenal Company: Examining Key Revenue Metrics
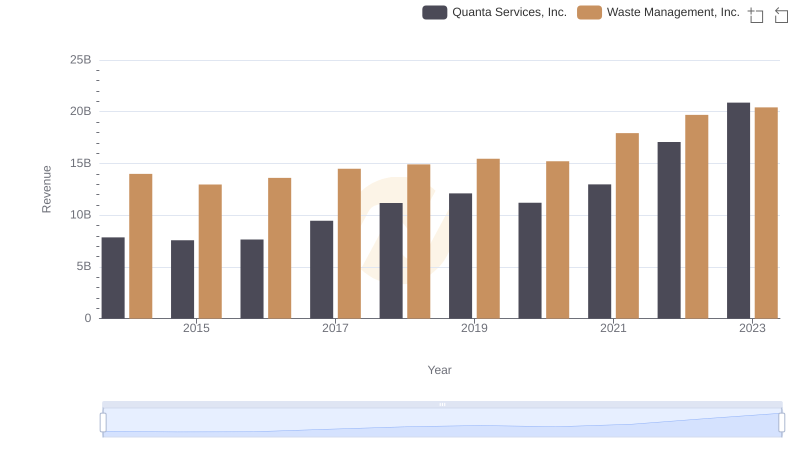
Waste Management, Inc. and Quanta Services, Inc.: A Comprehensive Revenue Analysis
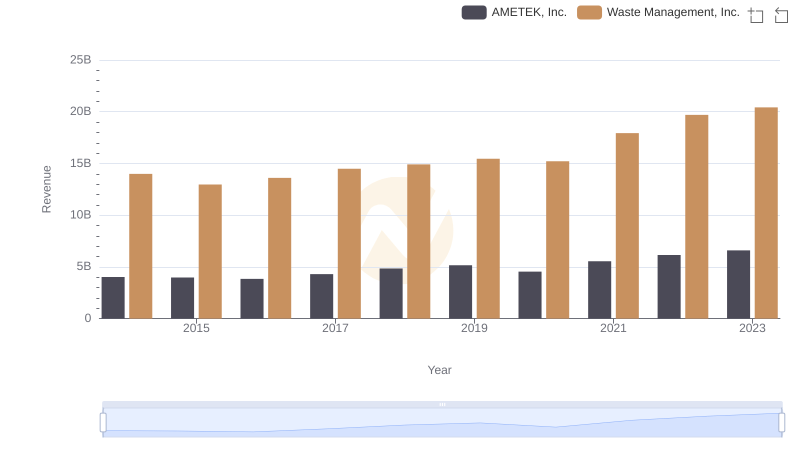
Waste Management, Inc. and AMETEK, Inc.: A Comprehensive Revenue Analysis
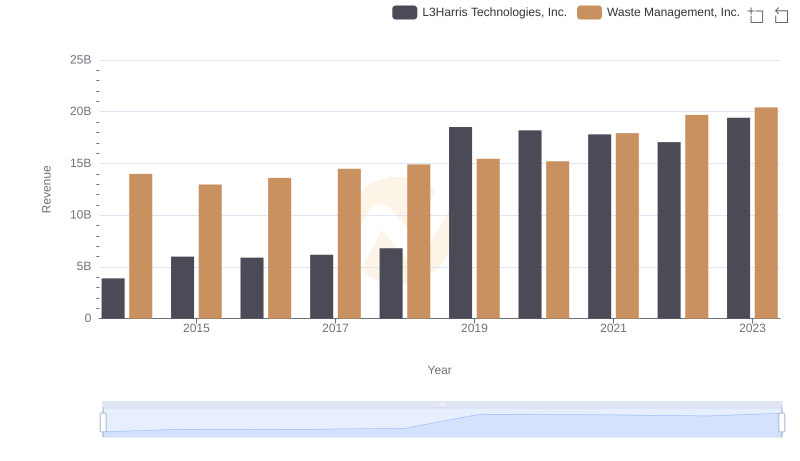
Waste Management, Inc. vs L3Harris Technologies, Inc.: Annual Revenue Growth Compared

Revenue Showdown: Waste Management, Inc. vs Old Dominion Freight Line, Inc.
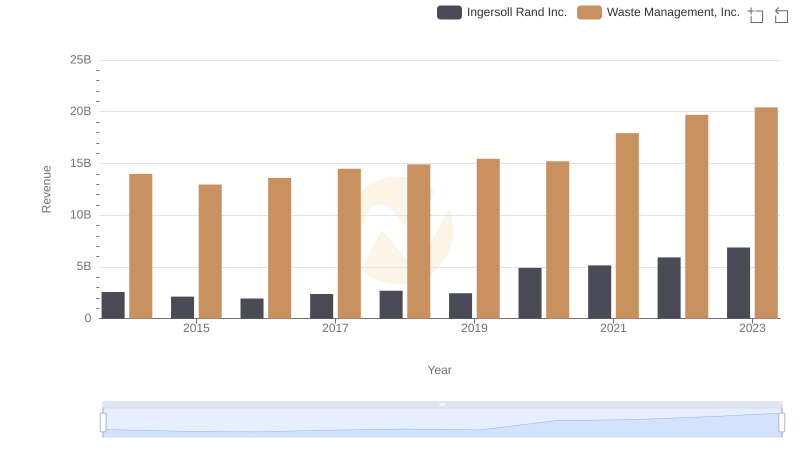
Annual Revenue Comparison: Waste Management, Inc. vs Ingersoll Rand Inc.
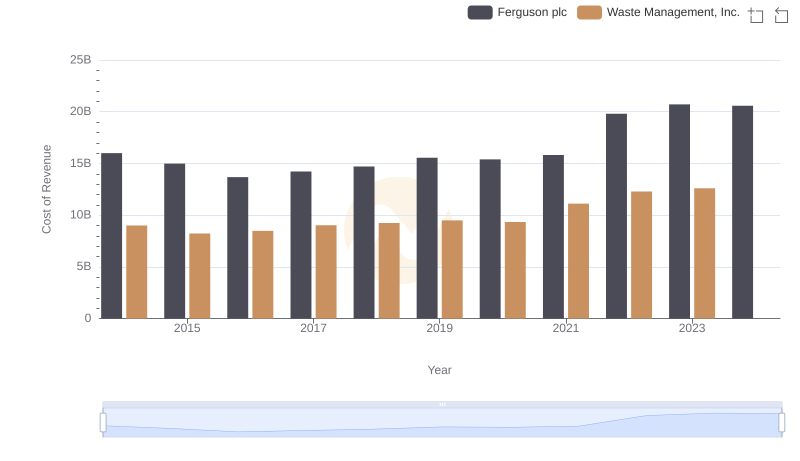
Cost of Revenue: Key Insights for Waste Management, Inc. and Ferguson plc
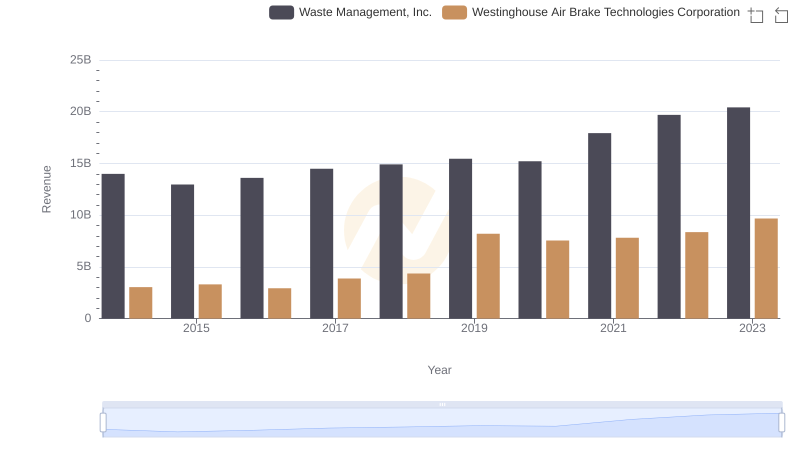
Revenue Showdown: Waste Management, Inc. vs Westinghouse Air Brake Technologies Corporation
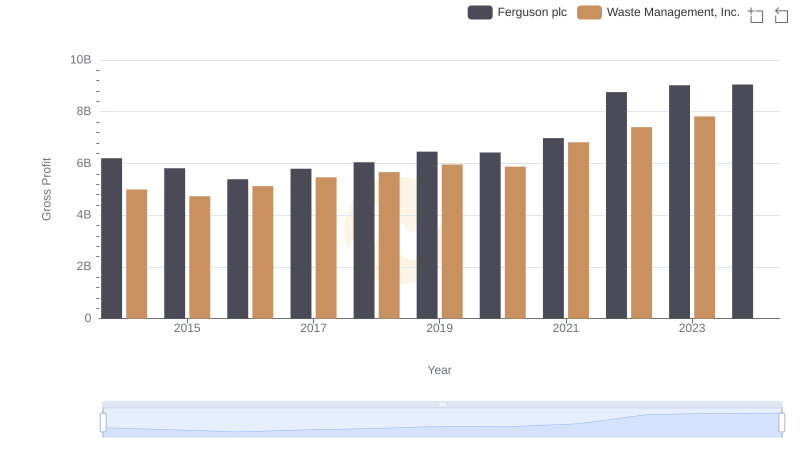
Gross Profit Trends Compared: Waste Management, Inc. vs Ferguson plc
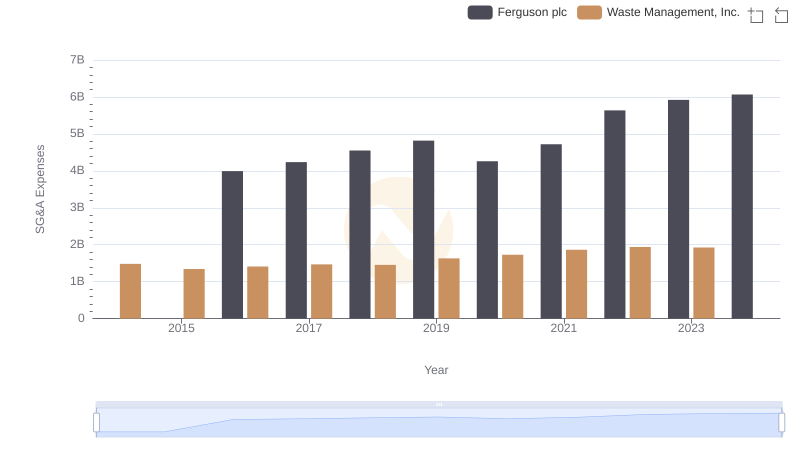
Breaking Down SG&A Expenses: Waste Management, Inc. vs Ferguson plc
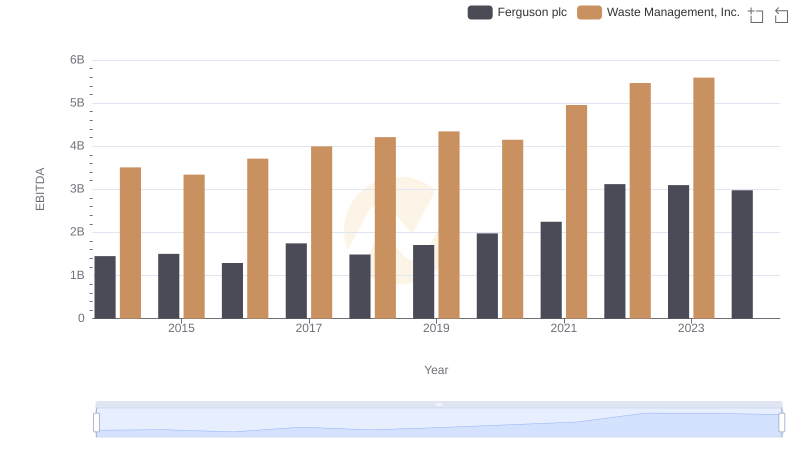
Waste Management, Inc. and Ferguson plc: A Detailed Examination of EBITDA Performance