| __timestamp | Ingersoll Rand Inc. | Waste Management, Inc. |
|---|---|---|
| Wednesday, January 1, 2014 | 1633224000 | 9002000000 |
| Thursday, January 1, 2015 | 1347800000 | 8231000000 |
| Friday, January 1, 2016 | 1222705000 | 8486000000 |
| Sunday, January 1, 2017 | 1477500000 | 9021000000 |
| Monday, January 1, 2018 | 1677300000 | 9249000000 |
| Tuesday, January 1, 2019 | 1540200000 | 9496000000 |
| Wednesday, January 1, 2020 | 3296800000 | 9341000000 |
| Friday, January 1, 2021 | 3163900000 | 11111000000 |
| Saturday, January 1, 2022 | 3590700000 | 12294000000 |
| Sunday, January 1, 2023 | 3993900000 | 12606000000 |
| Monday, January 1, 2024 | 0 | 13383000000 |
Infusing magic into the data realm
In the ever-evolving landscape of industrial and waste management sectors, Waste Management, Inc. and Ingersoll Rand Inc. stand as titans. Over the past decade, Waste Management, Inc. has consistently outpaced Ingersoll Rand Inc. in terms of cost of revenue. From 2014 to 2023, Waste Management's cost of revenue surged by approximately 40%, peaking at $12.6 billion in 2023. In contrast, Ingersoll Rand Inc. saw a more dramatic increase of over 140% during the same period, reaching nearly $4 billion. This stark contrast highlights the differing scales and operational strategies of these industry leaders. Waste Management's steady growth reflects its dominance in the waste sector, while Ingersoll Rand's sharp rise indicates a strategic expansion in its industrial operations. As these companies continue to evolve, their financial trajectories offer valuable insights into their market strategies and future potential.
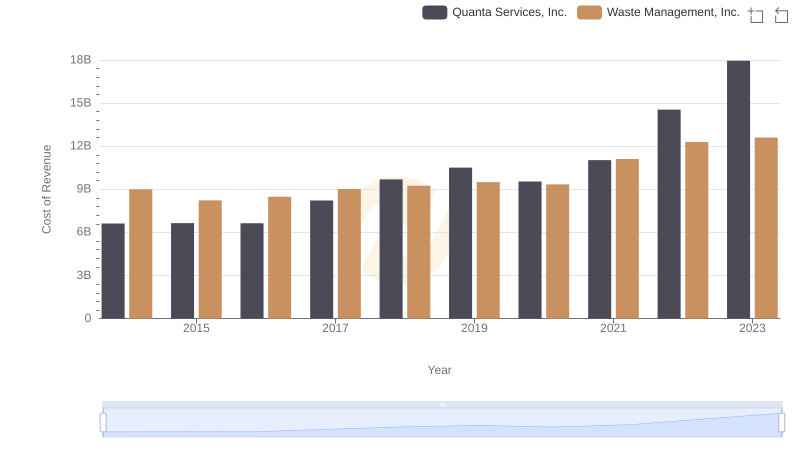
Cost of Revenue Comparison: Waste Management, Inc. vs Quanta Services, Inc.
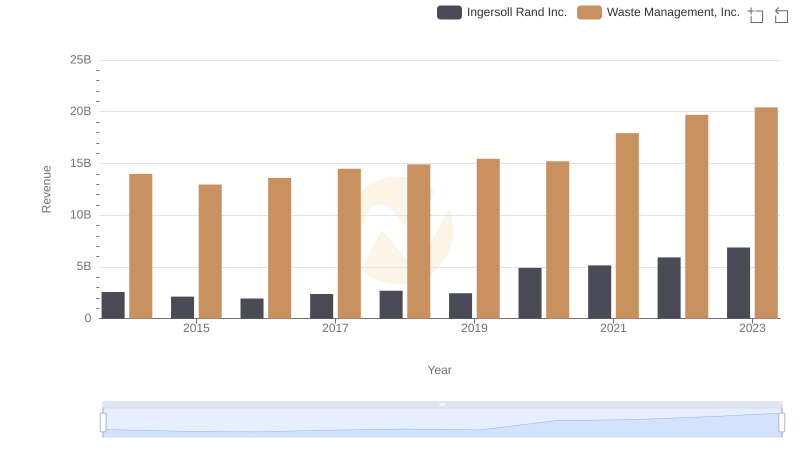
Annual Revenue Comparison: Waste Management, Inc. vs Ingersoll Rand Inc.
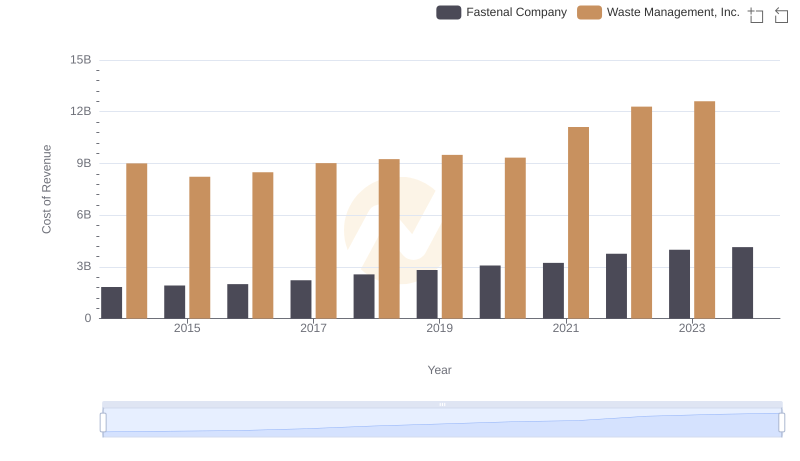
Comparing Cost of Revenue Efficiency: Waste Management, Inc. vs Fastenal Company
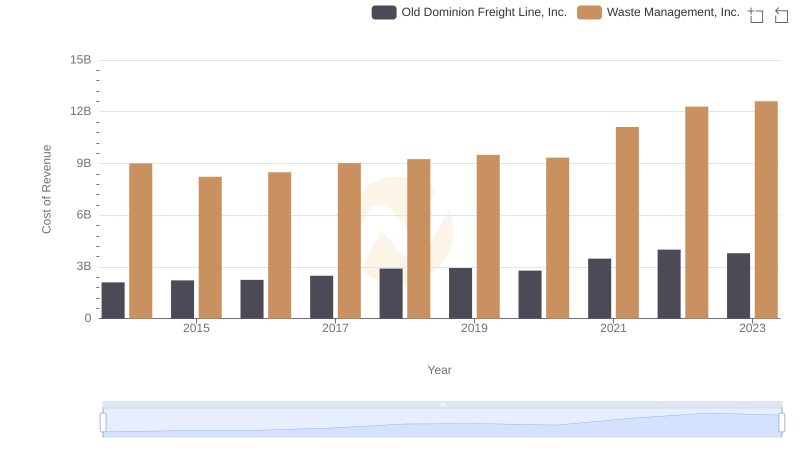
Cost of Revenue: Key Insights for Waste Management, Inc. and Old Dominion Freight Line, Inc.
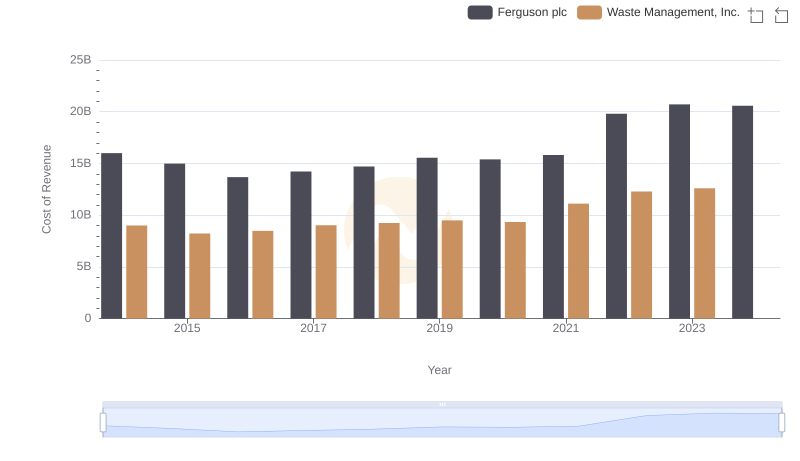
Cost of Revenue: Key Insights for Waste Management, Inc. and Ferguson plc
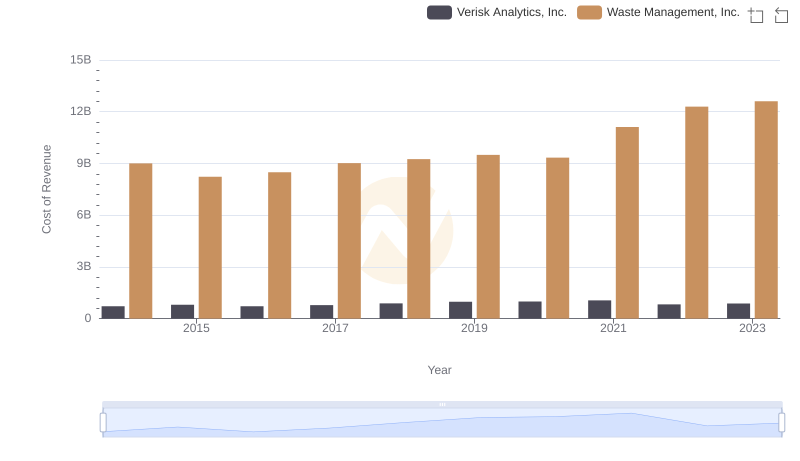
Comparing Cost of Revenue Efficiency: Waste Management, Inc. vs Verisk Analytics, Inc.
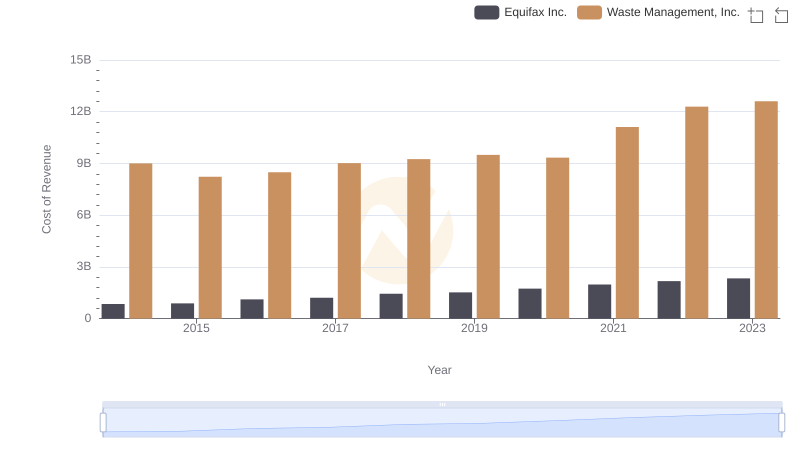
Comparing Cost of Revenue Efficiency: Waste Management, Inc. vs Equifax Inc.
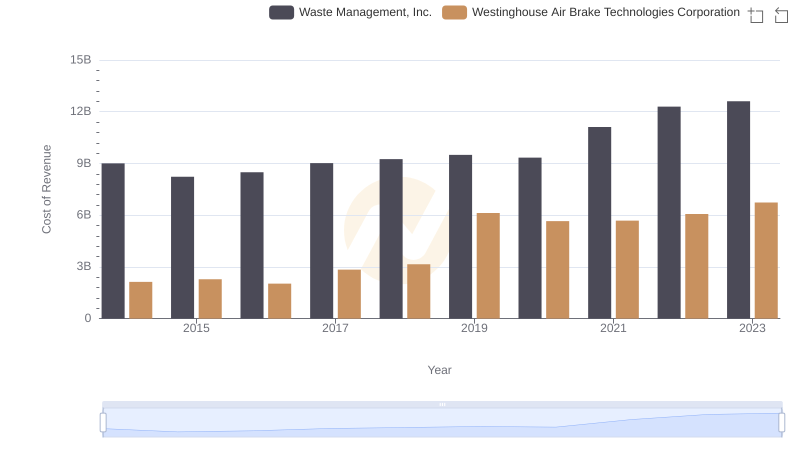
Cost of Revenue Comparison: Waste Management, Inc. vs Westinghouse Air Brake Technologies Corporation
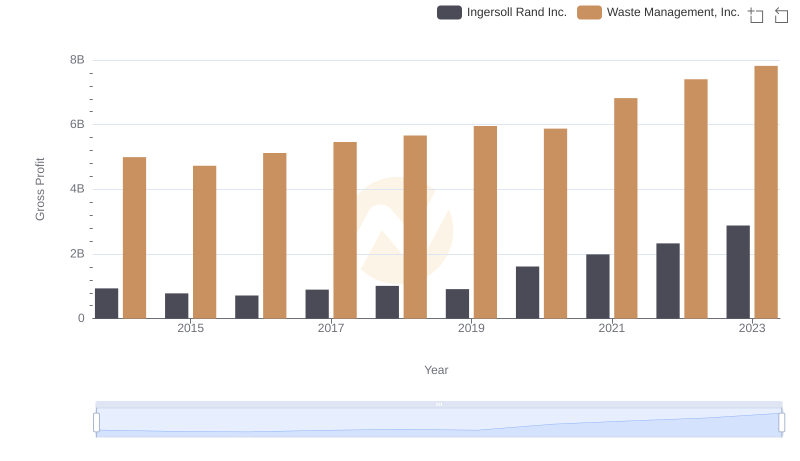
Key Insights on Gross Profit: Waste Management, Inc. vs Ingersoll Rand Inc.
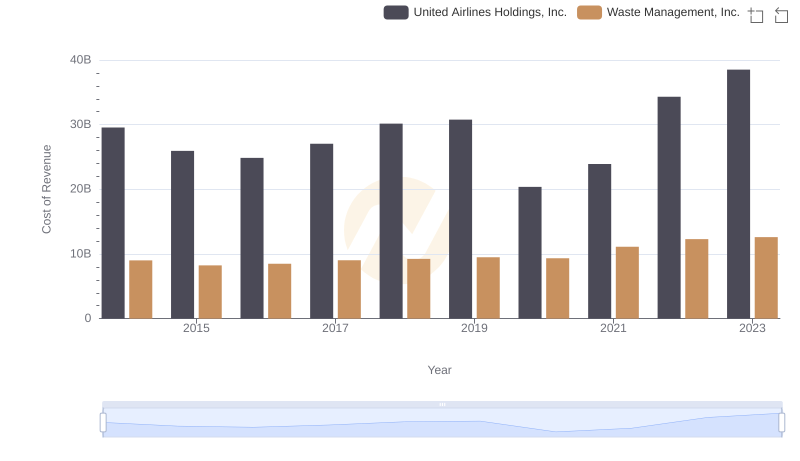
Cost Insights: Breaking Down Waste Management, Inc. and United Airlines Holdings, Inc.'s Expenses

Comparing SG&A Expenses: Waste Management, Inc. vs Ingersoll Rand Inc. Trends and Insights