| __timestamp | Quanta Services, Inc. | Waste Management, Inc. |
|---|---|---|
| Wednesday, January 1, 2014 | 6617730000 | 9002000000 |
| Thursday, January 1, 2015 | 6648771000 | 8231000000 |
| Friday, January 1, 2016 | 6637519000 | 8486000000 |
| Sunday, January 1, 2017 | 8224618000 | 9021000000 |
| Monday, January 1, 2018 | 9691459000 | 9249000000 |
| Tuesday, January 1, 2019 | 10511901000 | 9496000000 |
| Wednesday, January 1, 2020 | 9541825000 | 9341000000 |
| Friday, January 1, 2021 | 11026954000 | 11111000000 |
| Saturday, January 1, 2022 | 14544748000 | 12294000000 |
| Sunday, January 1, 2023 | 17945120000 | 12606000000 |
| Monday, January 1, 2024 | 13383000000 |
Infusing magic into the data realm
In the ever-evolving landscape of American industry, Waste Management, Inc. and Quanta Services, Inc. have been pivotal players. Over the past decade, from 2014 to 2023, these giants have showcased intriguing trends in their cost of revenue. Waste Management, a leader in environmental services, saw a steady increase in costs, peaking at approximately $12.6 billion in 2023, a 40% rise from 2014. Meanwhile, Quanta Services, a key player in infrastructure solutions, experienced a more dramatic surge, with costs skyrocketing by 171% to nearly $17.9 billion in the same period. This stark contrast highlights Quanta's aggressive expansion and adaptation strategies. As the world pivots towards sustainable solutions and infrastructure development, these trends offer a glimpse into the strategic maneuvers of two industry titans, each navigating their unique challenges and opportunities.
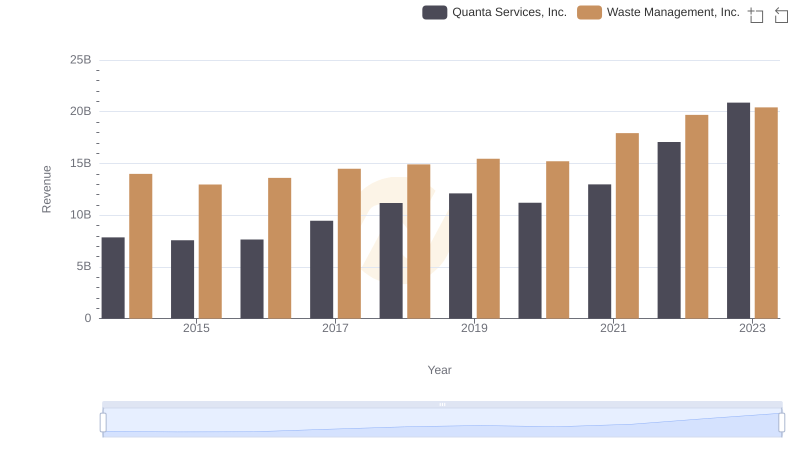
Waste Management, Inc. and Quanta Services, Inc.: A Comprehensive Revenue Analysis
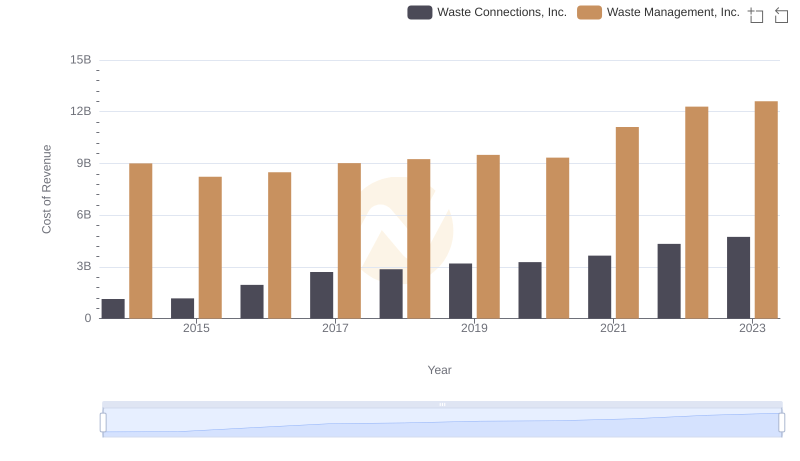
Waste Management, Inc. vs Waste Connections, Inc.: Efficiency in Cost of Revenue Explored
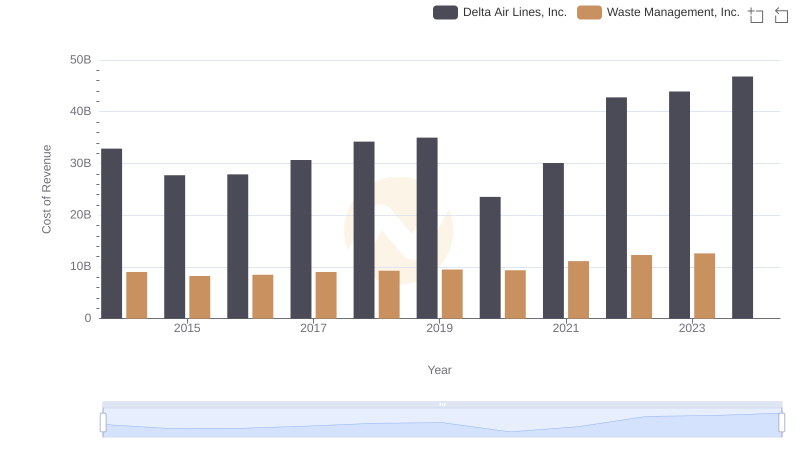
Cost of Revenue: Key Insights for Waste Management, Inc. and Delta Air Lines, Inc.
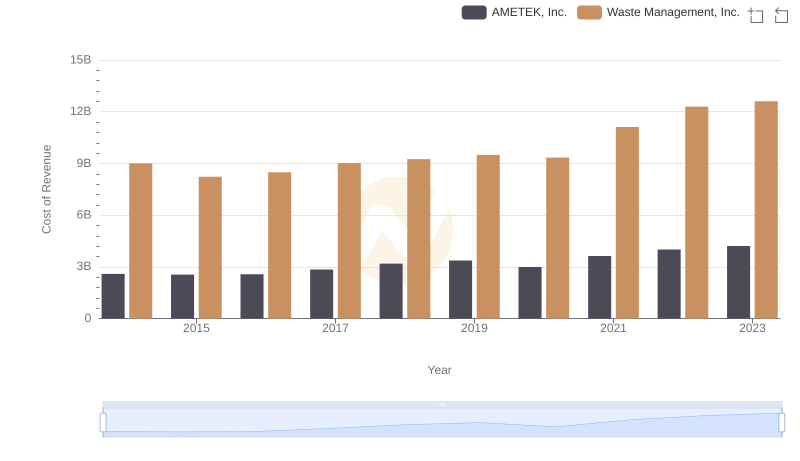
Waste Management, Inc. vs AMETEK, Inc.: Efficiency in Cost of Revenue Explored
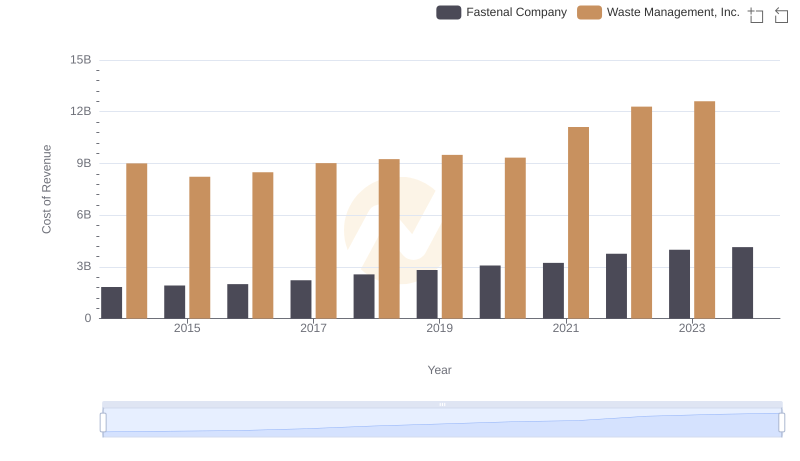
Comparing Cost of Revenue Efficiency: Waste Management, Inc. vs Fastenal Company
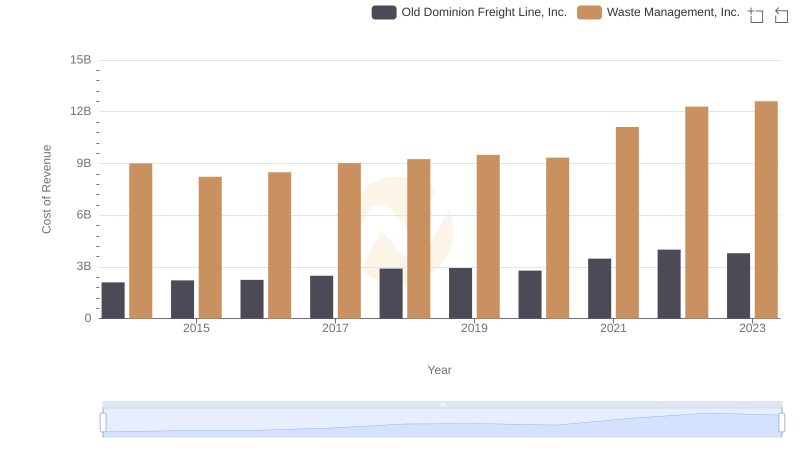
Cost of Revenue: Key Insights for Waste Management, Inc. and Old Dominion Freight Line, Inc.
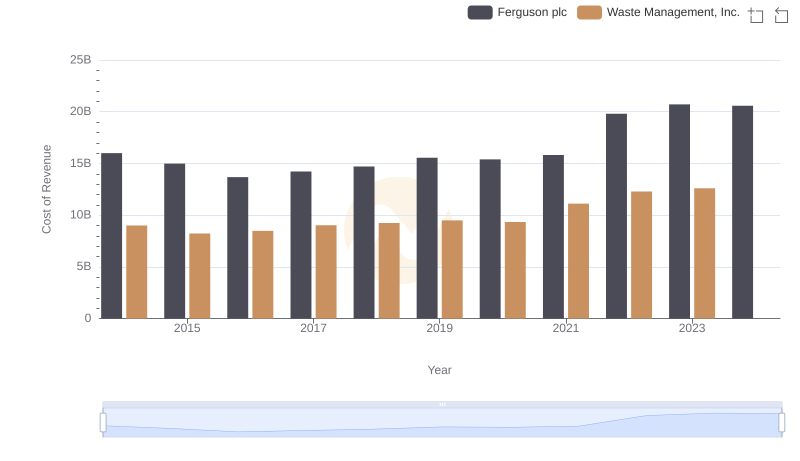
Cost of Revenue: Key Insights for Waste Management, Inc. and Ferguson plc
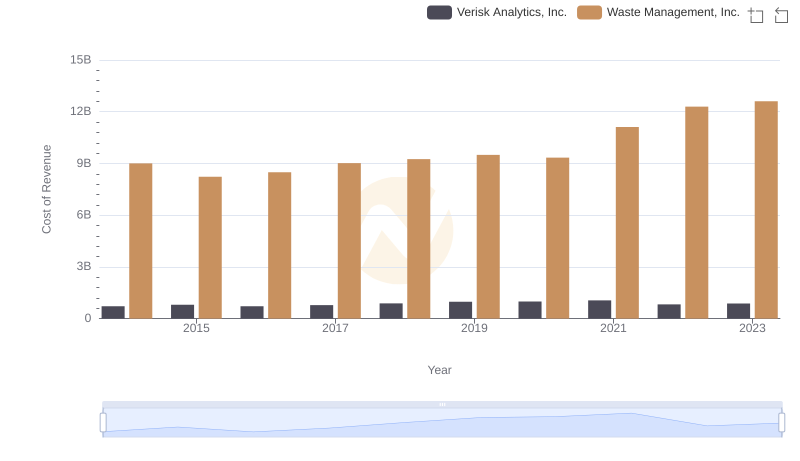
Comparing Cost of Revenue Efficiency: Waste Management, Inc. vs Verisk Analytics, Inc.
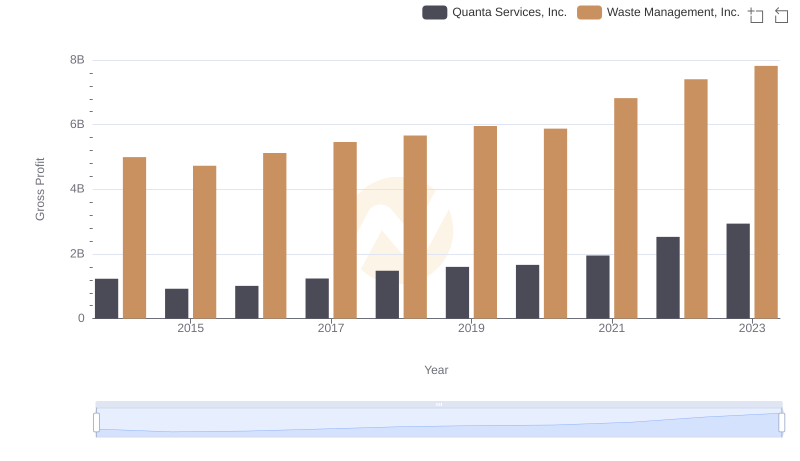
Waste Management, Inc. and Quanta Services, Inc.: A Detailed Gross Profit Analysis
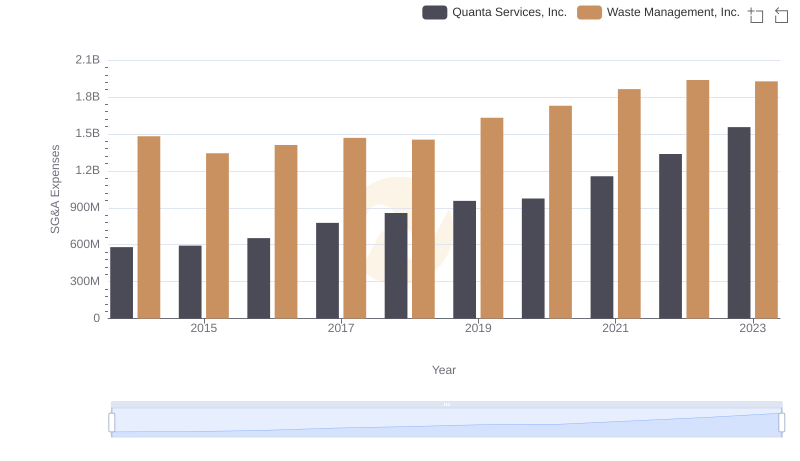
Operational Costs Compared: SG&A Analysis of Waste Management, Inc. and Quanta Services, Inc.
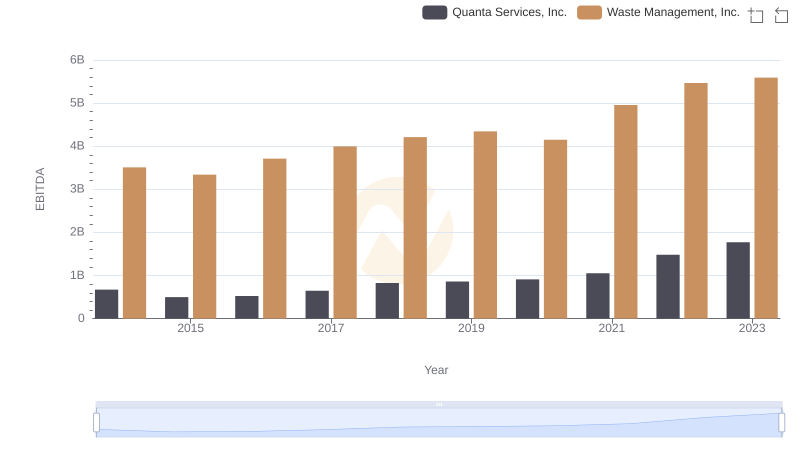
Professional EBITDA Benchmarking: Waste Management, Inc. vs Quanta Services, Inc.