| __timestamp | Delta Air Lines, Inc. | Waste Management, Inc. |
|---|---|---|
| Wednesday, January 1, 2014 | 32858000000 | 9002000000 |
| Thursday, January 1, 2015 | 27707000000 | 8231000000 |
| Friday, January 1, 2016 | 27876000000 | 8486000000 |
| Sunday, January 1, 2017 | 30671000000 | 9021000000 |
| Monday, January 1, 2018 | 34209000000 | 9249000000 |
| Tuesday, January 1, 2019 | 34982000000 | 9496000000 |
| Wednesday, January 1, 2020 | 23546000000 | 9341000000 |
| Friday, January 1, 2021 | 30078000000 | 11111000000 |
| Saturday, January 1, 2022 | 42767000000 | 12294000000 |
| Sunday, January 1, 2023 | 43913000000 | 12606000000 |
| Monday, January 1, 2024 | 46801000000 | 13383000000 |
Unleashing insights
In the ever-evolving landscape of corporate finance, understanding the cost of revenue is crucial for evaluating a company's operational efficiency. Waste Management, Inc. and Delta Air Lines, Inc. offer intriguing insights into this financial metric over the past decade.
From 2014 to 2023, Delta Air Lines experienced a significant fluctuation in its cost of revenue, peaking in 2024 with a 42% increase from its 2014 figures. This reflects the airline industry's volatile nature, influenced by factors such as fuel prices and global travel demand. In contrast, Waste Management, Inc. demonstrated a more stable trajectory, with a 40% rise in cost of revenue from 2014 to 2023, highlighting the steady demand for waste management services.
Interestingly, data for Waste Management in 2024 is missing, suggesting potential reporting delays or strategic shifts. This comparative analysis underscores the diverse challenges and opportunities faced by these industry giants.

Breaking Down Revenue Trends: Waste Management, Inc. vs Delta Air Lines, Inc.
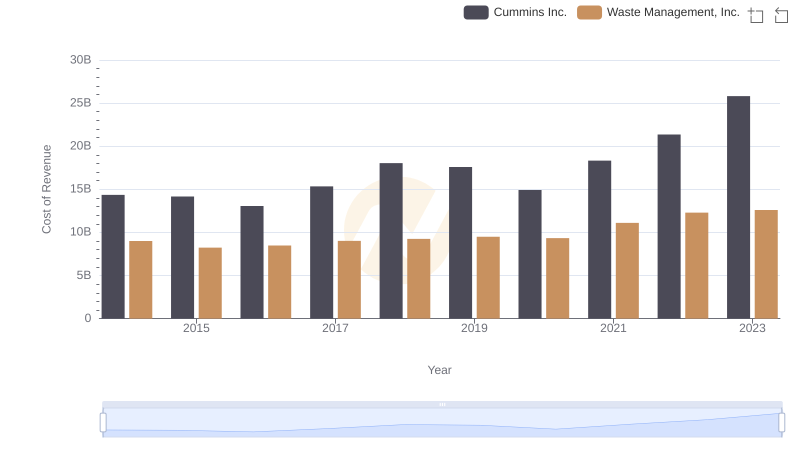
Waste Management, Inc. vs Cummins Inc.: Efficiency in Cost of Revenue Explored

Analyzing Cost of Revenue: Waste Management, Inc. and Axon Enterprise, Inc.
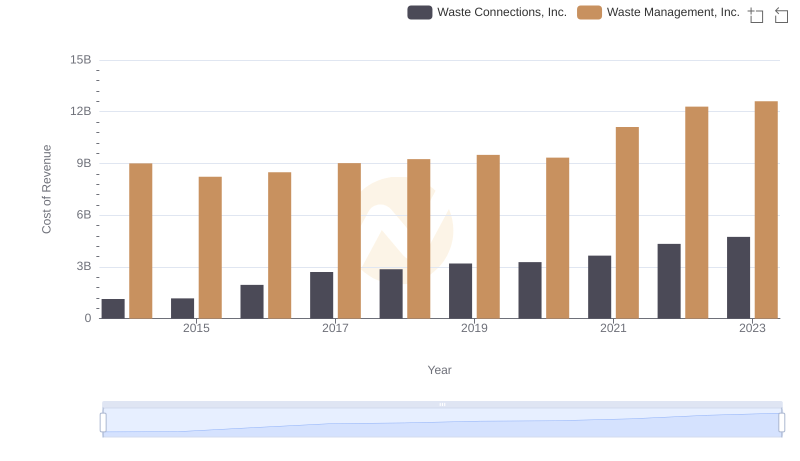
Waste Management, Inc. vs Waste Connections, Inc.: Efficiency in Cost of Revenue Explored
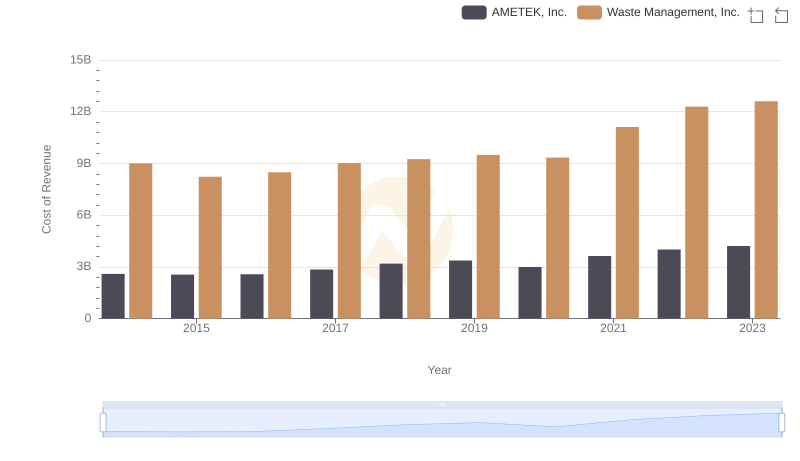
Waste Management, Inc. vs AMETEK, Inc.: Efficiency in Cost of Revenue Explored
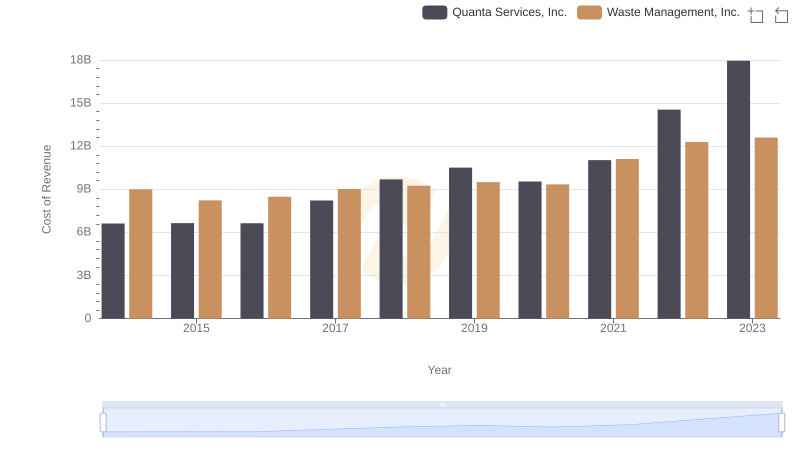
Cost of Revenue Comparison: Waste Management, Inc. vs Quanta Services, Inc.
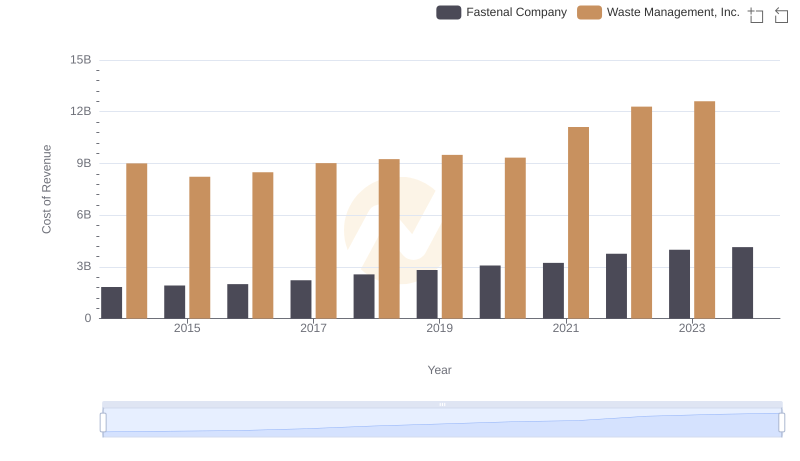
Comparing Cost of Revenue Efficiency: Waste Management, Inc. vs Fastenal Company
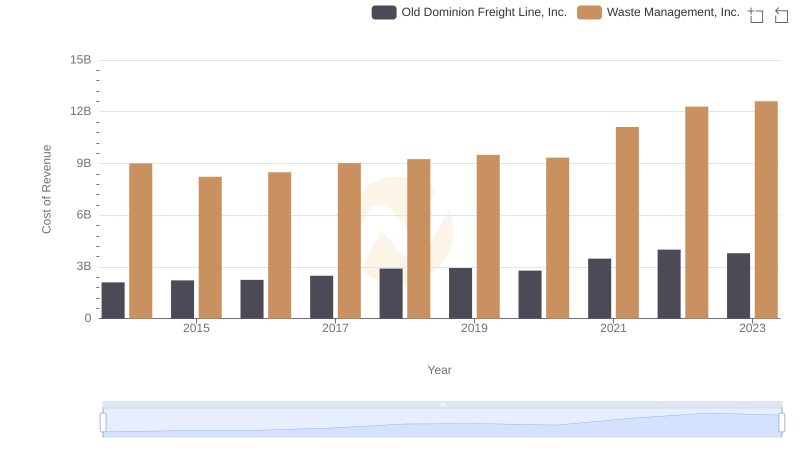
Cost of Revenue: Key Insights for Waste Management, Inc. and Old Dominion Freight Line, Inc.
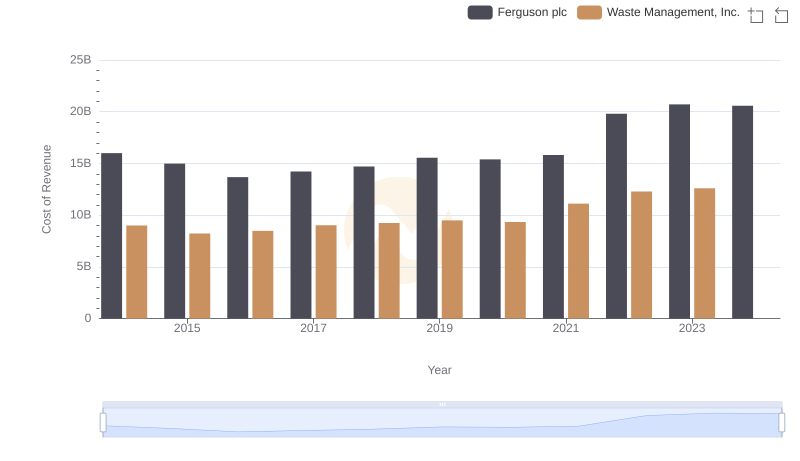
Cost of Revenue: Key Insights for Waste Management, Inc. and Ferguson plc
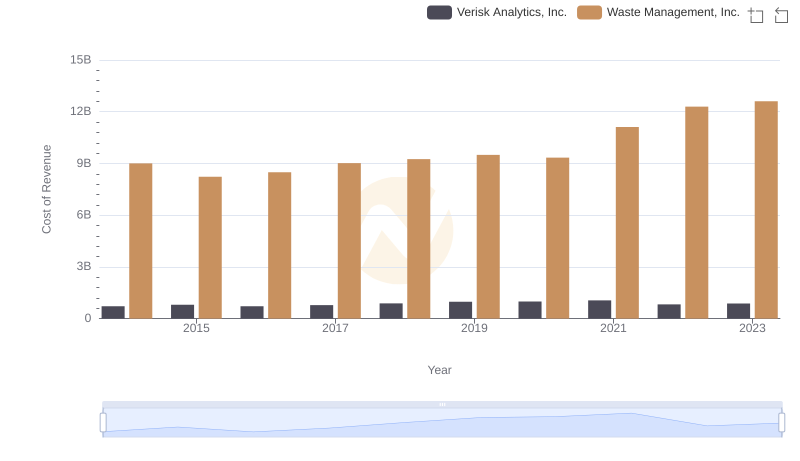
Comparing Cost of Revenue Efficiency: Waste Management, Inc. vs Verisk Analytics, Inc.
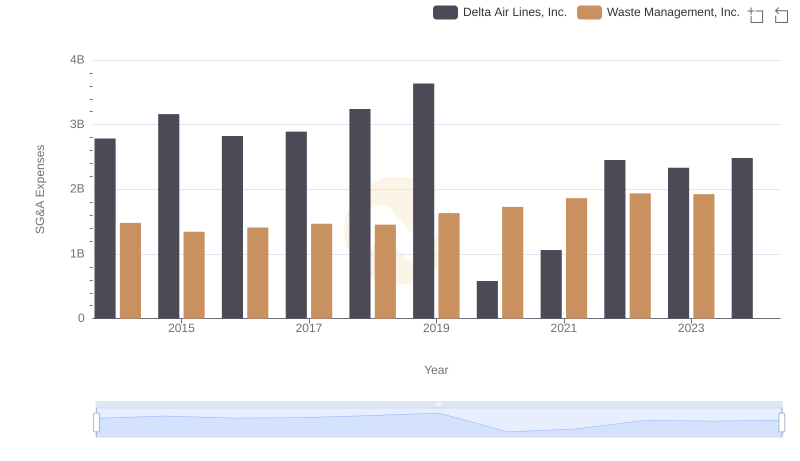
Waste Management, Inc. or Delta Air Lines, Inc.: Who Manages SG&A Costs Better?