| __timestamp | Axon Enterprise, Inc. | Waste Connections, Inc. |
|---|---|---|
| Wednesday, January 1, 2014 | 62977000 | 1138388000 |
| Thursday, January 1, 2015 | 69245000 | 1177409000 |
| Friday, January 1, 2016 | 97709000 | 1957712000 |
| Sunday, January 1, 2017 | 136710000 | 2704775000 |
| Monday, January 1, 2018 | 161485000 | 2865704000 |
| Tuesday, January 1, 2019 | 223574000 | 3198757000 |
| Wednesday, January 1, 2020 | 264672000 | 3276808000 |
| Friday, January 1, 2021 | 322471000 | 3654074000 |
| Saturday, January 1, 2022 | 461297000 | 4336012000 |
| Sunday, January 1, 2023 | 608009000 | 4744513000 |
| Monday, January 1, 2024 | 5191706000 |
Unlocking the unknown
In the ever-evolving landscape of corporate finance, understanding cost structures is pivotal. Over the past decade, Waste Connections, Inc. and Axon Enterprise, Inc. have showcased contrasting trajectories in their cost of revenue. Waste Connections, a leader in waste management, has seen its cost of revenue grow by approximately 317% from 2014 to 2023, reflecting its expansive operations and market reach. In contrast, Axon Enterprise, known for its innovative public safety solutions, experienced a staggering 866% increase in the same period, highlighting its rapid growth and scaling efforts.
While Waste Connections consistently maintained a higher cost base, indicative of its established market presence, Axon's exponential rise underscores its aggressive expansion strategy. This comparison not only sheds light on their financial strategies but also offers insights into their respective industry dynamics. As we move forward, these trends will be crucial for investors and stakeholders alike.
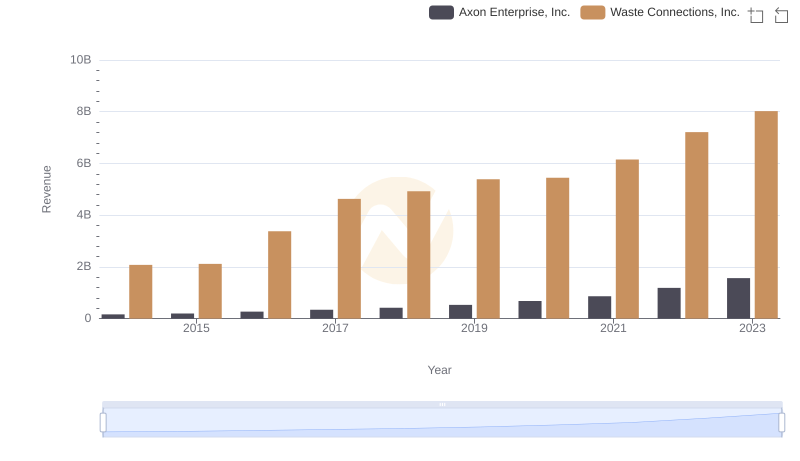
Waste Connections, Inc. vs Axon Enterprise, Inc.: Annual Revenue Growth Compared
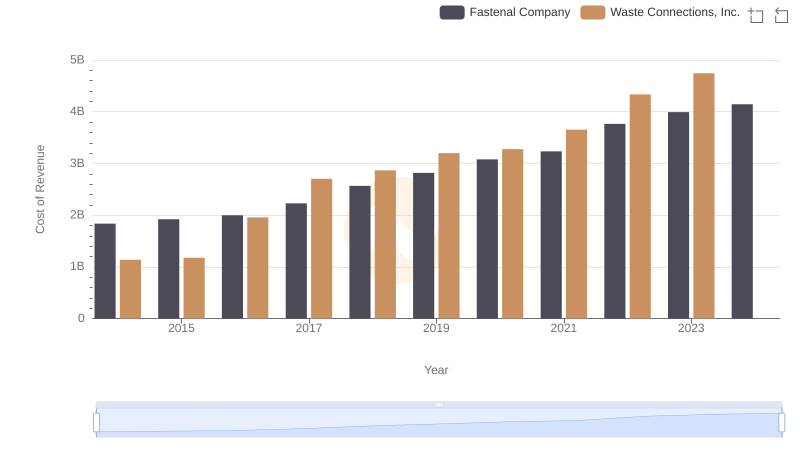
Comparing Cost of Revenue Efficiency: Waste Connections, Inc. vs Fastenal Company
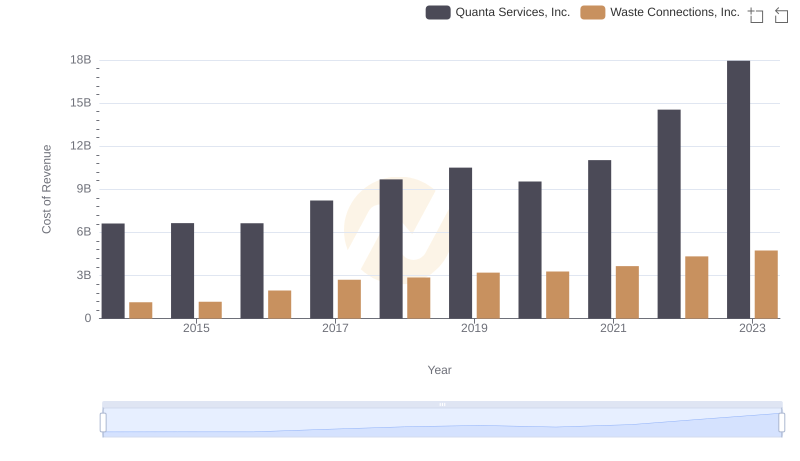
Cost of Revenue: Key Insights for Waste Connections, Inc. and Quanta Services, Inc.
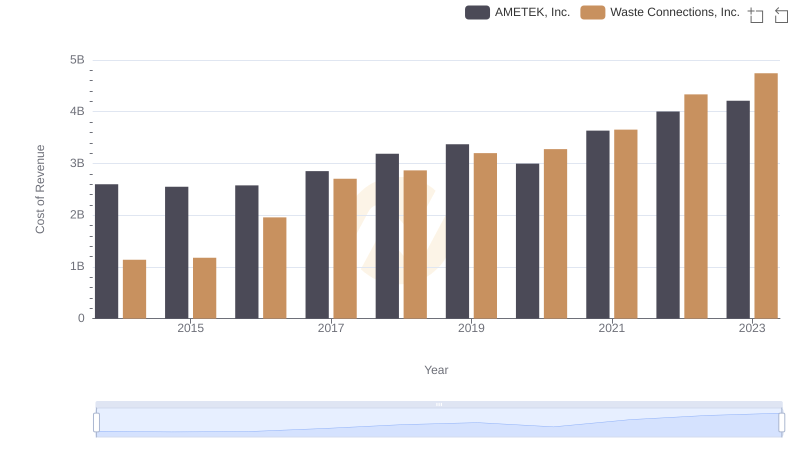
Cost of Revenue: Key Insights for Waste Connections, Inc. and AMETEK, Inc.
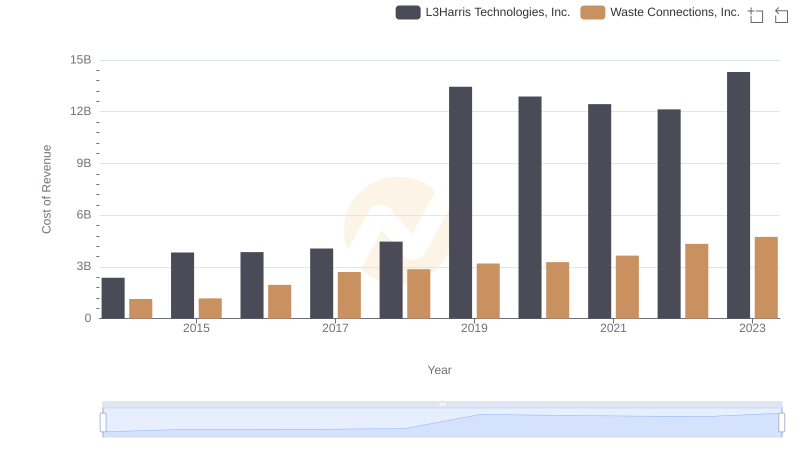
Cost of Revenue: Key Insights for Waste Connections, Inc. and L3Harris Technologies, Inc.
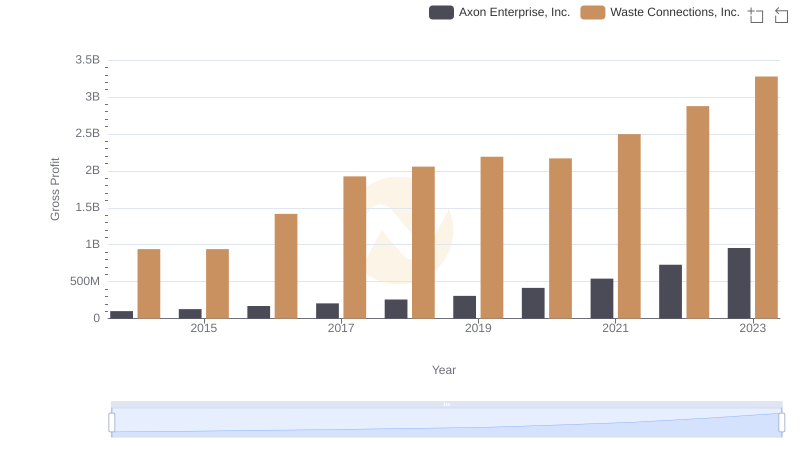
Who Generates Higher Gross Profit? Waste Connections, Inc. or Axon Enterprise, Inc.
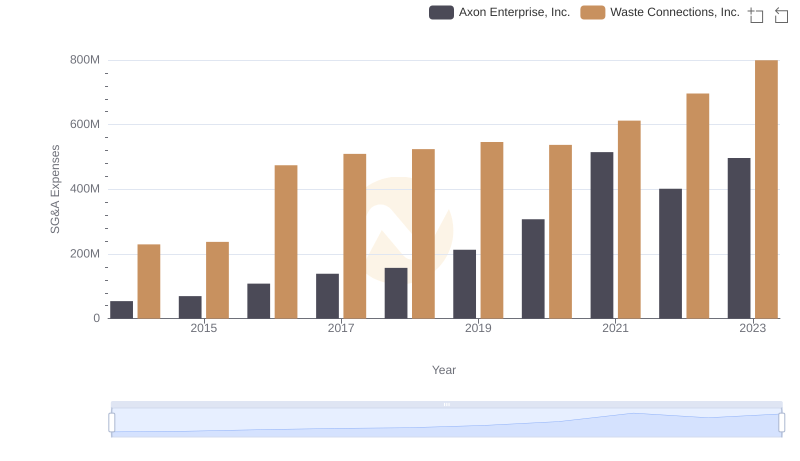
Waste Connections, Inc. vs Axon Enterprise, Inc.: SG&A Expense Trends
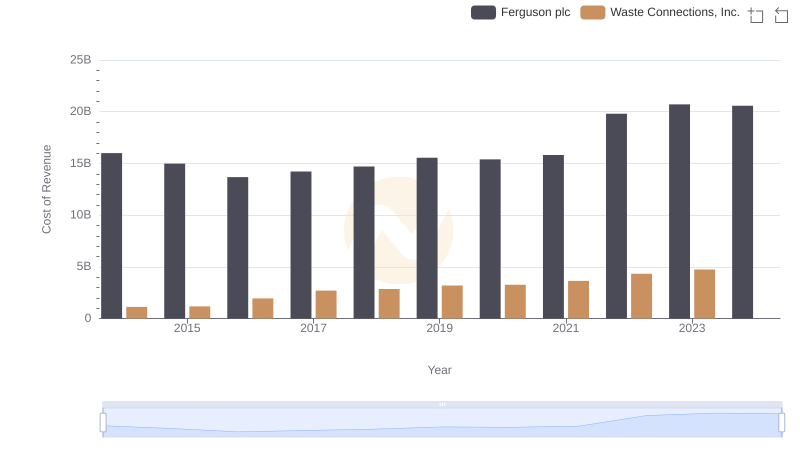
Cost of Revenue Comparison: Waste Connections, Inc. vs Ferguson plc