| __timestamp | Fastenal Company | Waste Connections, Inc. |
|---|---|---|
| Wednesday, January 1, 2014 | 1836105000 | 1138388000 |
| Thursday, January 1, 2015 | 1920253000 | 1177409000 |
| Friday, January 1, 2016 | 1997259000 | 1957712000 |
| Sunday, January 1, 2017 | 2226900000 | 2704775000 |
| Monday, January 1, 2018 | 2566200000 | 2865704000 |
| Tuesday, January 1, 2019 | 2818300000 | 3198757000 |
| Wednesday, January 1, 2020 | 3079500000 | 3276808000 |
| Friday, January 1, 2021 | 3233700000 | 3654074000 |
| Saturday, January 1, 2022 | 3764800000 | 4336012000 |
| Sunday, January 1, 2023 | 3992200000 | 4744513000 |
| Monday, January 1, 2024 | 4144100000 | 5191706000 |
Igniting the spark of knowledge
In the ever-evolving landscape of corporate efficiency, Waste Connections, Inc. and Fastenal Company stand as intriguing case studies. Over the past decade, these two giants have showcased distinct trajectories in managing their cost of revenue. Fastenal Company, a leader in industrial supplies, has seen its cost of revenue grow by approximately 126% from 2014 to 2023. Meanwhile, Waste Connections, Inc., a prominent player in waste management, has experienced a staggering 317% increase over the same period.
This comparison highlights the differing operational challenges and efficiencies between the industrial supply and waste management sectors. Notably, Waste Connections, Inc. has consistently outpaced Fastenal in cost growth, reflecting its aggressive expansion and acquisition strategy. However, the data for 2024 remains incomplete, leaving room for speculation on future trends. As these companies continue to evolve, their cost management strategies will be pivotal in shaping their competitive edge.
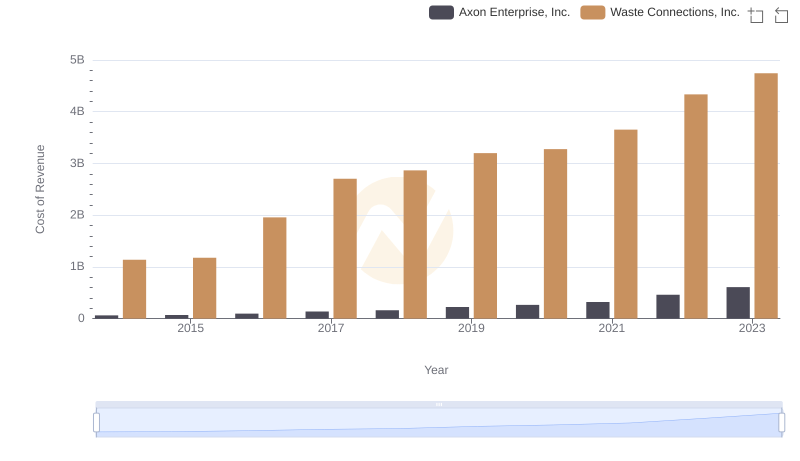
Cost of Revenue Comparison: Waste Connections, Inc. vs Axon Enterprise, Inc.
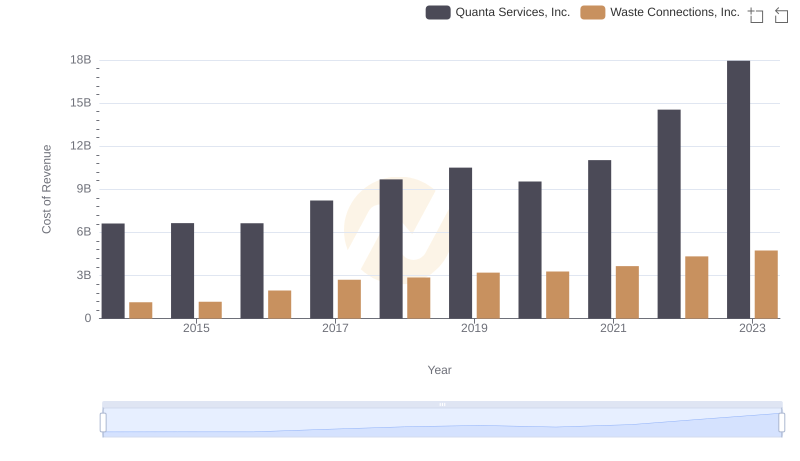
Cost of Revenue: Key Insights for Waste Connections, Inc. and Quanta Services, Inc.
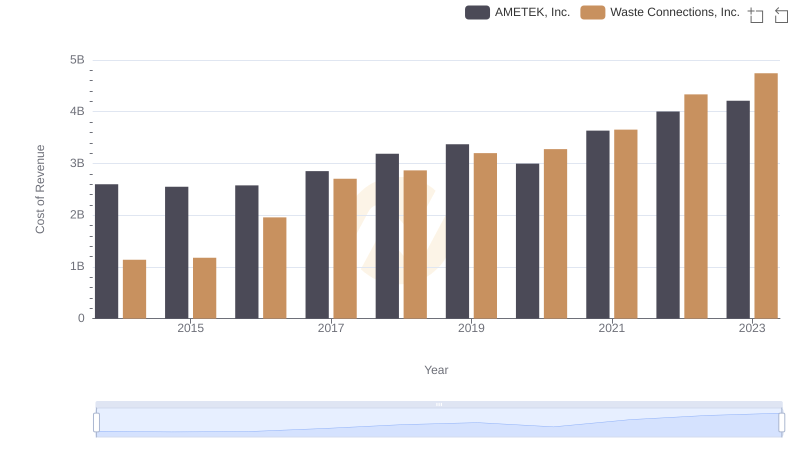
Cost of Revenue: Key Insights for Waste Connections, Inc. and AMETEK, Inc.
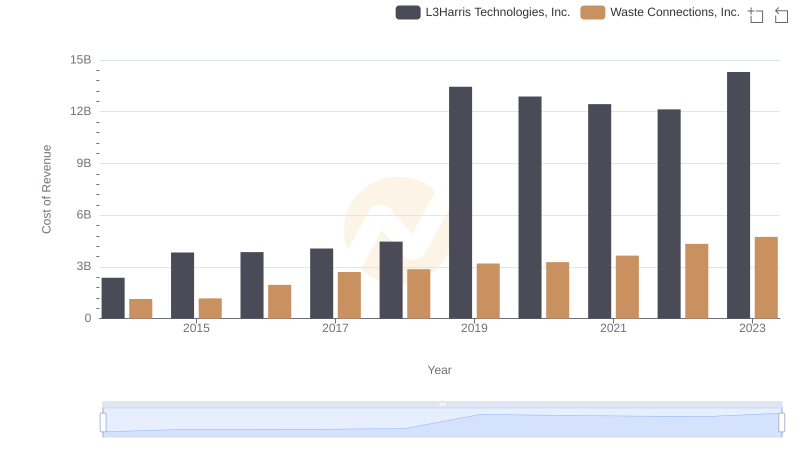
Cost of Revenue: Key Insights for Waste Connections, Inc. and L3Harris Technologies, Inc.

Who Generates Higher Gross Profit? Waste Connections, Inc. or Fastenal Company
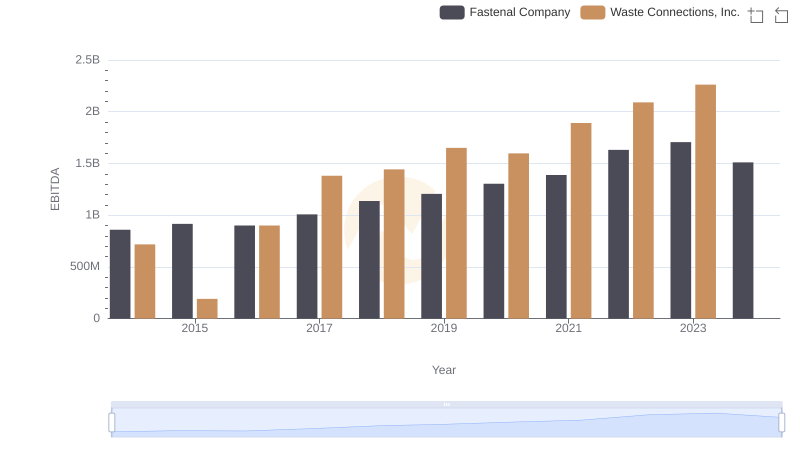
EBITDA Performance Review: Waste Connections, Inc. vs Fastenal Company