| __timestamp | Cintas Corporation | Union Pacific Corporation |
|---|---|---|
| Wednesday, January 1, 2014 | 2637426000 | 14311000000 |
| Thursday, January 1, 2015 | 2555549000 | 12837000000 |
| Friday, January 1, 2016 | 2775588000 | 11672000000 |
| Sunday, January 1, 2017 | 2943086000 | 12231000000 |
| Monday, January 1, 2018 | 3568109000 | 13293000000 |
| Tuesday, January 1, 2019 | 3763715000 | 12094000000 |
| Wednesday, January 1, 2020 | 3851372000 | 10354000000 |
| Friday, January 1, 2021 | 3801689000 | 11290000000 |
| Saturday, January 1, 2022 | 4222213000 | 13670000000 |
| Sunday, January 1, 2023 | 4642401000 | 13590000000 |
| Monday, January 1, 2024 | 4910199000 | 13211000000 |
Unleashing insights
In the ever-evolving landscape of American industry, Union Pacific Corporation and Cintas Corporation stand as titans in their respective fields. From 2014 to 2024, these companies have showcased distinct trends in their cost of revenue, reflecting their strategic priorities and market dynamics.
Union Pacific, a leader in the transportation sector, has seen its cost of revenue fluctuate over the years. Notably, from 2014 to 2023, there was a 5% decrease, highlighting efficiency improvements and cost management strategies. However, the peak in 2014 at approximately $14.3 billion underscores the challenges faced in earlier years.
Conversely, Cintas, a major player in corporate services, has experienced a steady increase in its cost of revenue, rising by nearly 86% from 2014 to 2024. This growth trajectory reflects its expanding market presence and investment in service delivery.
This comparative analysis offers a window into the operational strategies of these industry giants, providing valuable insights for investors and analysts alike.
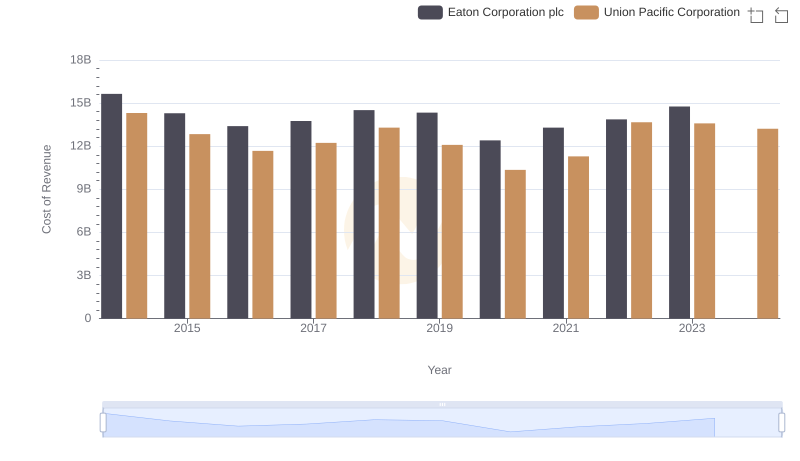
Comparing Cost of Revenue Efficiency: Union Pacific Corporation vs Eaton Corporation plc
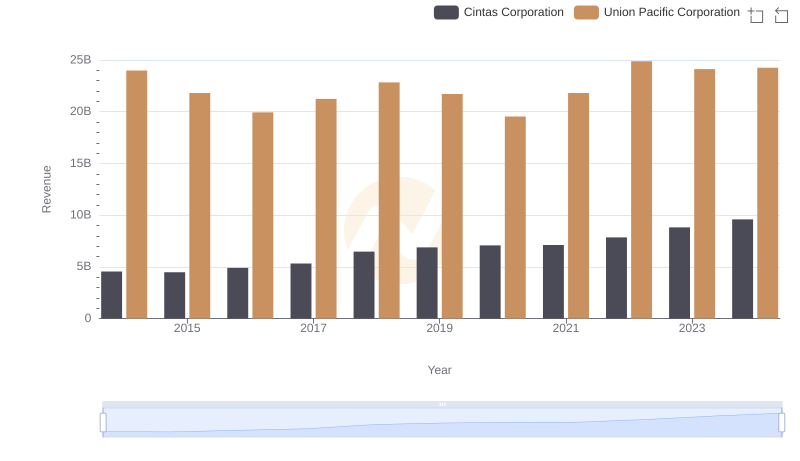
Revenue Insights: Union Pacific Corporation and Cintas Corporation Performance Compared
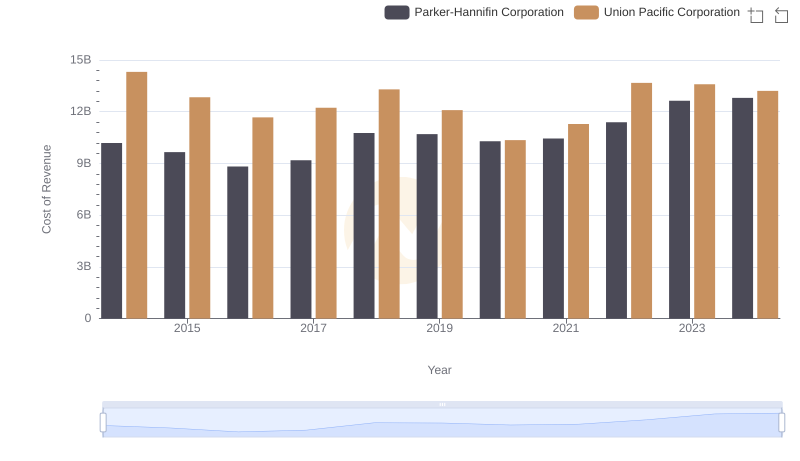
Union Pacific Corporation vs Parker-Hannifin Corporation: Efficiency in Cost of Revenue Explored

Cost Insights: Breaking Down Union Pacific Corporation and Trane Technologies plc's Expenses
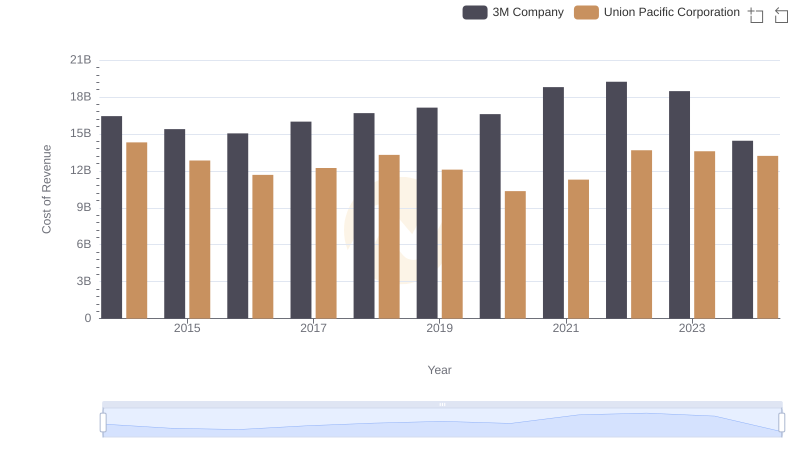
Cost of Revenue: Key Insights for Union Pacific Corporation and 3M Company

Union Pacific Corporation vs Cintas Corporation: A Gross Profit Performance Breakdown
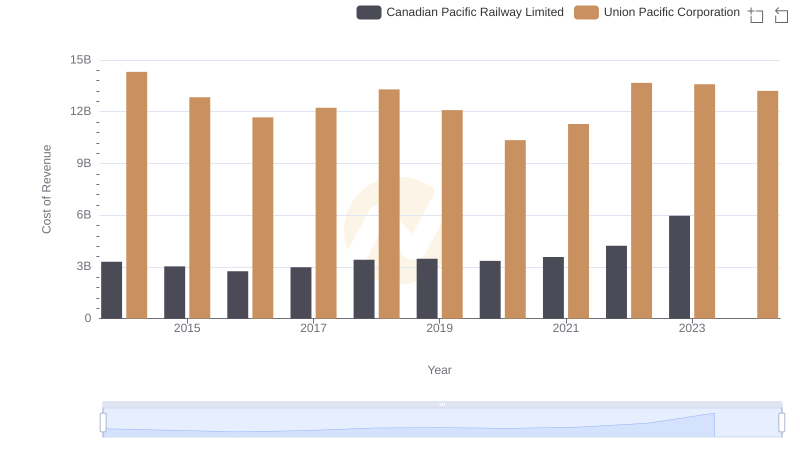
Analyzing Cost of Revenue: Union Pacific Corporation and Canadian Pacific Railway Limited
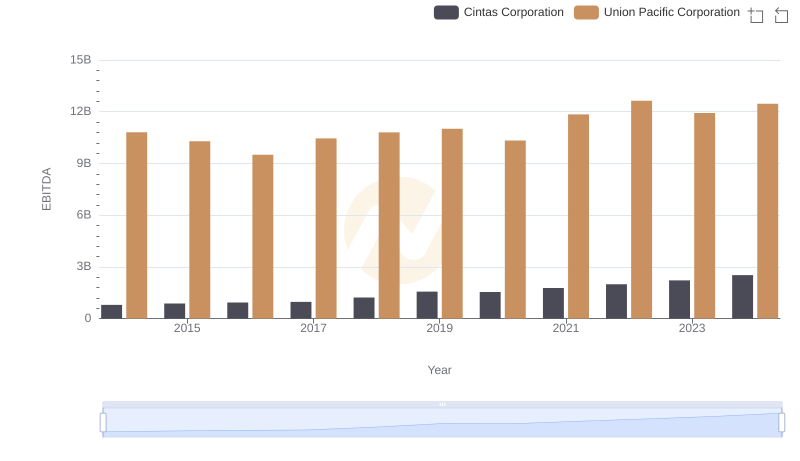
A Side-by-Side Analysis of EBITDA: Union Pacific Corporation and Cintas Corporation