| __timestamp | Parker-Hannifin Corporation | Union Pacific Corporation |
|---|---|---|
| Wednesday, January 1, 2014 | 10188227000 | 14311000000 |
| Thursday, January 1, 2015 | 9655245000 | 12837000000 |
| Friday, January 1, 2016 | 8823384000 | 11672000000 |
| Sunday, January 1, 2017 | 9188962000 | 12231000000 |
| Monday, January 1, 2018 | 10762841000 | 13293000000 |
| Tuesday, January 1, 2019 | 10703484000 | 12094000000 |
| Wednesday, January 1, 2020 | 10286518000 | 10354000000 |
| Friday, January 1, 2021 | 10449680000 | 11290000000 |
| Saturday, January 1, 2022 | 11387267000 | 13670000000 |
| Sunday, January 1, 2023 | 12635892000 | 13590000000 |
| Monday, January 1, 2024 | 12801816000 | 13211000000 |
Data in motion
In the ever-evolving landscape of industrial giants, understanding cost efficiency is paramount. Union Pacific Corporation and Parker-Hannifin Corporation, two stalwarts in their respective fields, offer a fascinating study in cost management over the past decade. From 2014 to 2024, Union Pacific's cost of revenue has shown a notable fluctuation, peaking in 2014 and 2022, with a slight decline in 2023. Meanwhile, Parker-Hannifin has demonstrated a steady increase, with a remarkable 45% rise from 2016 to 2024.
This comparative analysis underscores the dynamic strategies employed by these corporations in navigating economic challenges and opportunities.

Who Generates More Revenue? Union Pacific Corporation or Parker-Hannifin Corporation

Analyzing Cost of Revenue: Union Pacific Corporation and United Parcel Service, Inc.
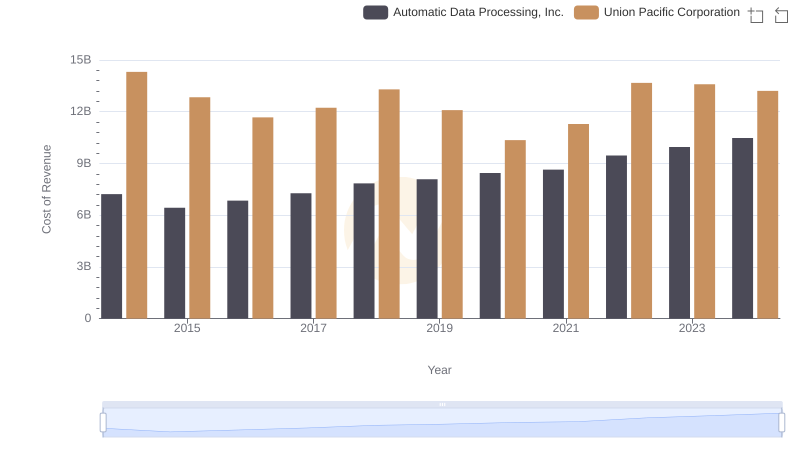
Cost of Revenue: Key Insights for Union Pacific Corporation and Automatic Data Processing, Inc.
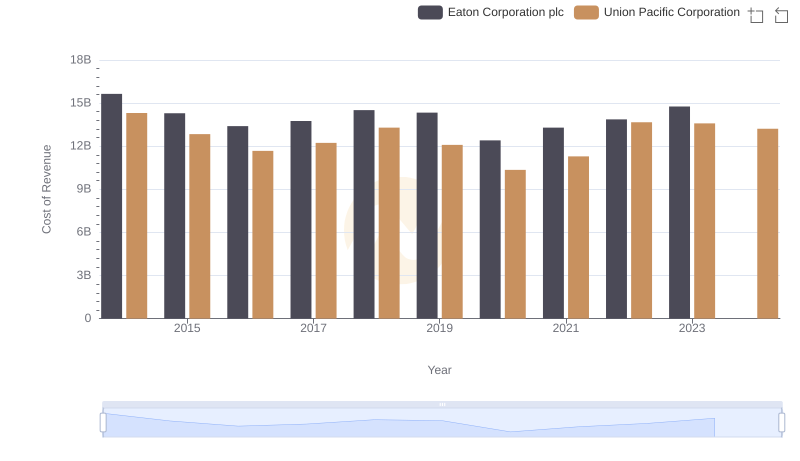
Comparing Cost of Revenue Efficiency: Union Pacific Corporation vs Eaton Corporation plc

Cost Insights: Breaking Down Union Pacific Corporation and Trane Technologies plc's Expenses
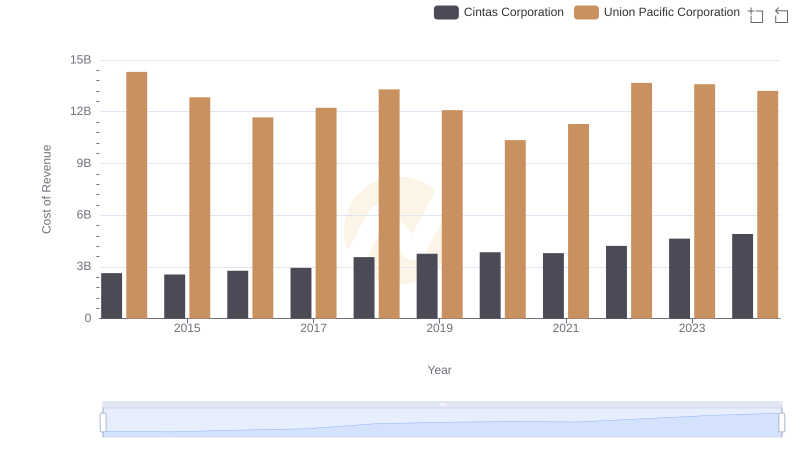
Cost of Revenue: Key Insights for Union Pacific Corporation and Cintas Corporation