| __timestamp | 3M Company | Union Pacific Corporation |
|---|---|---|
| Wednesday, January 1, 2014 | 16447000000 | 14311000000 |
| Thursday, January 1, 2015 | 15383000000 | 12837000000 |
| Friday, January 1, 2016 | 15040000000 | 11672000000 |
| Sunday, January 1, 2017 | 16001000000 | 12231000000 |
| Monday, January 1, 2018 | 16682000000 | 13293000000 |
| Tuesday, January 1, 2019 | 17136000000 | 12094000000 |
| Wednesday, January 1, 2020 | 16605000000 | 10354000000 |
| Friday, January 1, 2021 | 18795000000 | 11290000000 |
| Saturday, January 1, 2022 | 19232000000 | 13670000000 |
| Sunday, January 1, 2023 | 18477000000 | 13590000000 |
| Monday, January 1, 2024 | 14447000000 | 13211000000 |
Data in motion
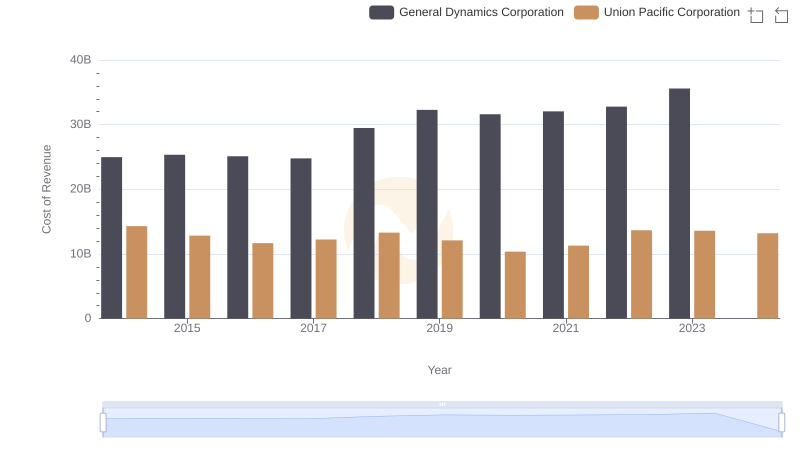
In the ever-evolving landscape of American industry, understanding the cost of revenue is crucial for evaluating a company's financial health. This analysis delves into the cost of revenue trends for Union Pacific Corporation and 3M Company from 2014 to 2024. Over this decade, 3M's cost of revenue peaked in 2022, reaching approximately 19.2 billion, before declining by 25% in 2024. Meanwhile, Union Pacific's cost of revenue showed a more stable trajectory, with a notable dip in 2020, likely due to global disruptions, before recovering to around 13.6 billion in 2022. By 2024, Union Pacific's cost of revenue slightly decreased to 13.2 billion. These trends highlight the resilience and adaptability of these industrial giants in the face of economic challenges. As we look to the future, monitoring these financial metrics will be key to understanding their strategic directions.
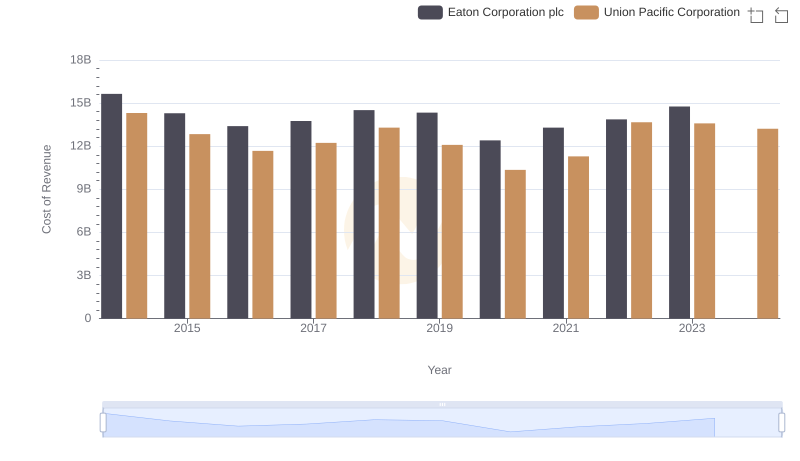
Comparing Cost of Revenue Efficiency: Union Pacific Corporation vs Eaton Corporation plc
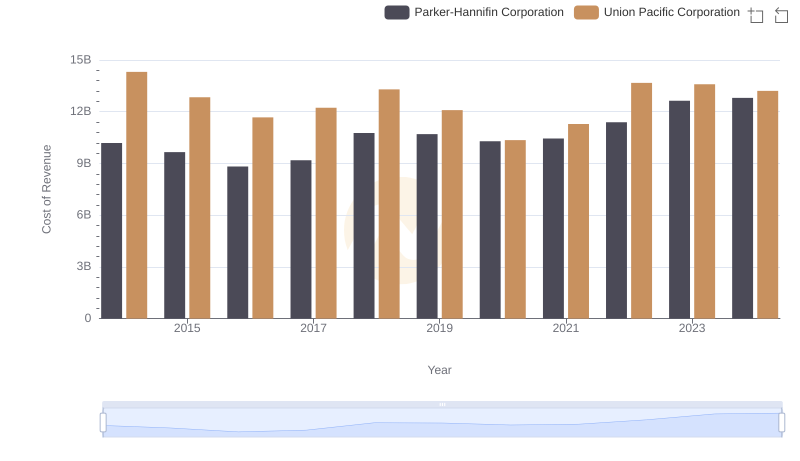
Union Pacific Corporation vs Parker-Hannifin Corporation: Efficiency in Cost of Revenue Explored

Cost Insights: Breaking Down Union Pacific Corporation and Trane Technologies plc's Expenses
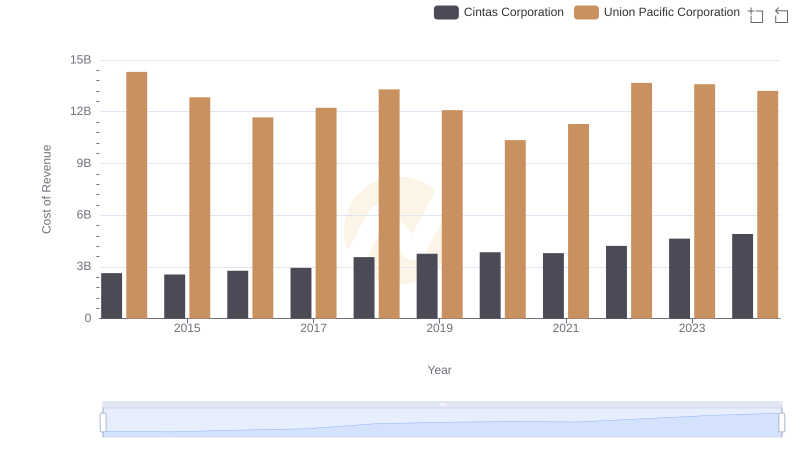
Cost of Revenue: Key Insights for Union Pacific Corporation and Cintas Corporation
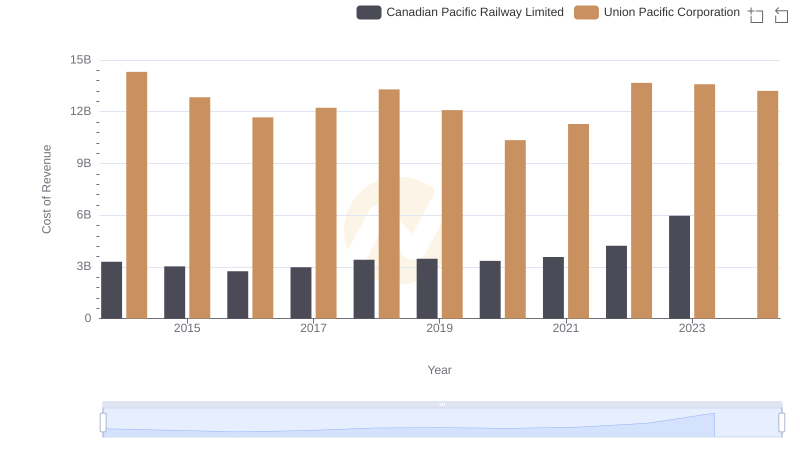
Analyzing Cost of Revenue: Union Pacific Corporation and Canadian Pacific Railway Limited
Cost of Revenue Comparison: Union Pacific Corporation vs General Dynamics Corporation