| __timestamp | Cintas Corporation | Union Pacific Corporation |
|---|---|---|
| Wednesday, January 1, 2014 | 1914386000 | 9677000000 |
| Thursday, January 1, 2015 | 1921337000 | 8976000000 |
| Friday, January 1, 2016 | 2129870000 | 8269000000 |
| Sunday, January 1, 2017 | 2380295000 | 9009000000 |
| Monday, January 1, 2018 | 2908523000 | 9539000000 |
| Tuesday, January 1, 2019 | 3128588000 | 9614000000 |
| Wednesday, January 1, 2020 | 3233748000 | 9179000000 |
| Friday, January 1, 2021 | 3314651000 | 10514000000 |
| Saturday, January 1, 2022 | 3632246000 | 11205000000 |
| Sunday, January 1, 2023 | 4173368000 | 10529000000 |
| Monday, January 1, 2024 | 4686416000 | 11039000000 |
Unlocking the unknown
In the world of American business, Union Pacific Corporation and Cintas Corporation stand as titans in their respective industries. Over the past decade, these companies have showcased remarkable growth in gross profit, reflecting their strategic prowess and market adaptability.
Union Pacific, a leader in the transportation sector, has consistently demonstrated robust financial health. From 2014 to 2024, its gross profit surged by approximately 14%, peaking in 2022. This growth underscores the company's resilience and ability to navigate economic fluctuations.
Meanwhile, Cintas, a key player in the corporate services industry, has experienced a staggering 145% increase in gross profit over the same period. This remarkable growth trajectory highlights Cintas' successful expansion strategies and its ability to capitalize on market opportunities.
In conclusion, while both companies have thrived, Cintas' growth rate outpaces Union Pacific, offering intriguing insights into their operational strategies.
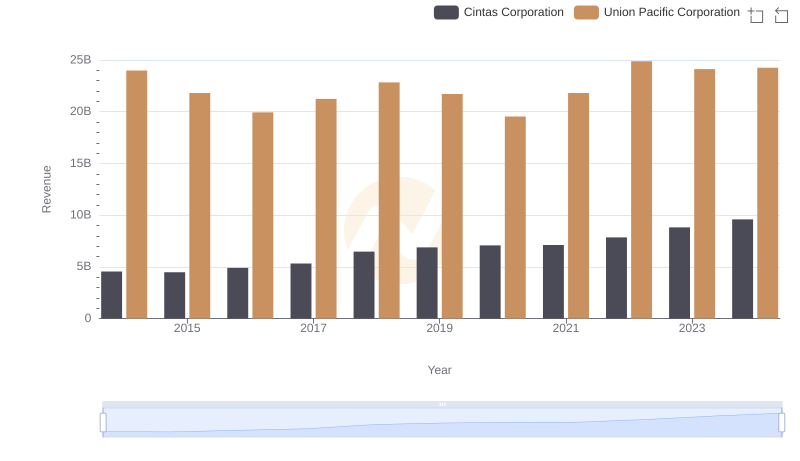
Revenue Insights: Union Pacific Corporation and Cintas Corporation Performance Compared

Union Pacific Corporation vs Deere & Company: A Gross Profit Performance Breakdown
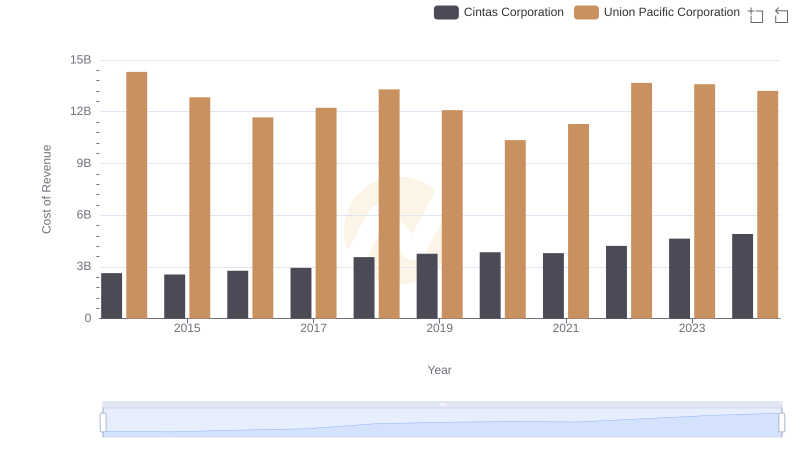
Cost of Revenue: Key Insights for Union Pacific Corporation and Cintas Corporation
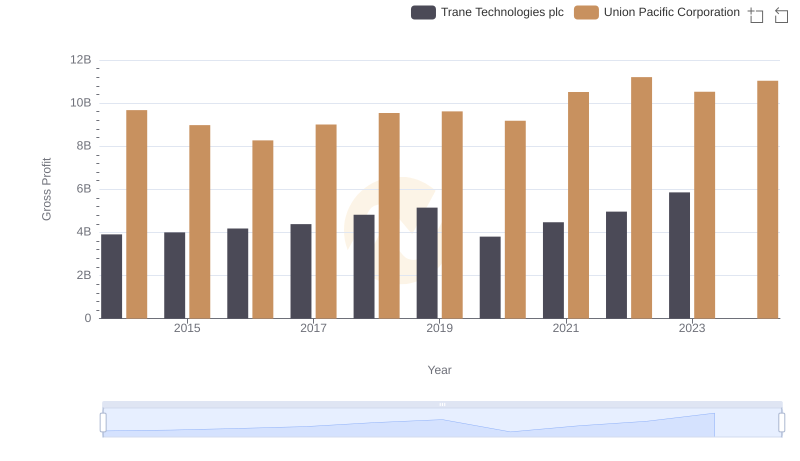
Union Pacific Corporation vs Trane Technologies plc: A Gross Profit Performance Breakdown
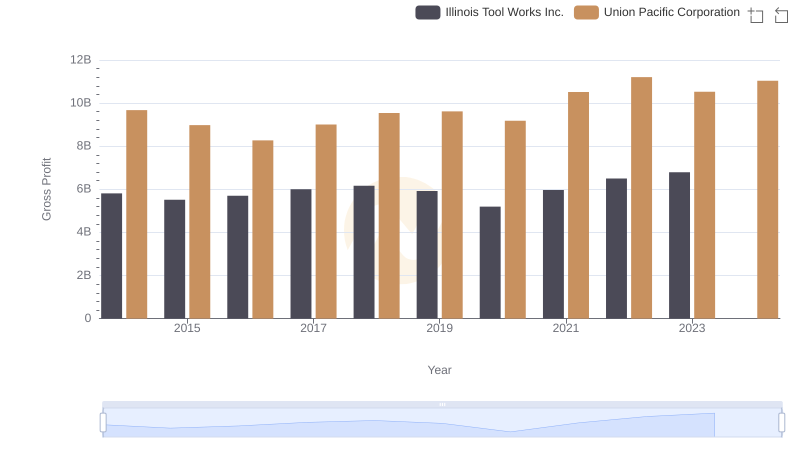
Union Pacific Corporation vs Illinois Tool Works Inc.: A Gross Profit Performance Breakdown
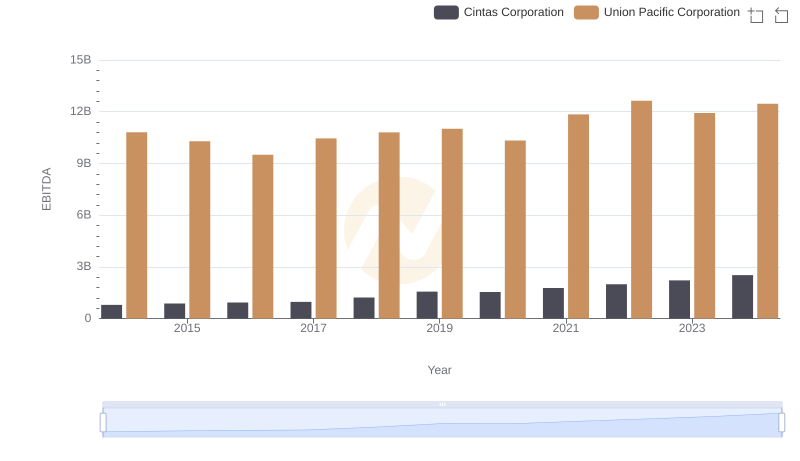
A Side-by-Side Analysis of EBITDA: Union Pacific Corporation and Cintas Corporation