| __timestamp | Cintas Corporation | Union Pacific Corporation |
|---|---|---|
| Wednesday, January 1, 2014 | 793811000 | 10808000000 |
| Thursday, January 1, 2015 | 877761000 | 10290000000 |
| Friday, January 1, 2016 | 933728000 | 9502000000 |
| Sunday, January 1, 2017 | 968293000 | 10456000000 |
| Monday, January 1, 2018 | 1227852000 | 10802000000 |
| Tuesday, January 1, 2019 | 1564228000 | 11013000000 |
| Wednesday, January 1, 2020 | 1542737000 | 10331000000 |
| Friday, January 1, 2021 | 1773591000 | 11843000000 |
| Saturday, January 1, 2022 | 1990046000 | 12636000000 |
| Sunday, January 1, 2023 | 2221676000 | 11928000000 |
| Monday, January 1, 2024 | 2523857000 | 12461000000 |
Unleashing the power of data
In the world of corporate finance, EBITDA (Earnings Before Interest, Taxes, Depreciation, and Amortization) serves as a key indicator of a company's financial health. Over the past decade, Union Pacific Corporation and Cintas Corporation have demonstrated remarkable growth in this metric, reflecting their robust business strategies and market adaptability.
From 2014 to 2024, Cintas Corporation's EBITDA surged by over 200%, showcasing its impressive expansion in the uniform rental and facility services industry. Meanwhile, Union Pacific Corporation, a titan in the railroad sector, maintained a steady EBITDA growth of approximately 15%, underscoring its resilience in a competitive market.
This side-by-side analysis highlights the contrasting yet successful paths of these two industry leaders. While Cintas capitalized on service diversification, Union Pacific leveraged its extensive rail network to sustain profitability. As we look to the future, both companies are well-positioned to continue their upward trajectories.
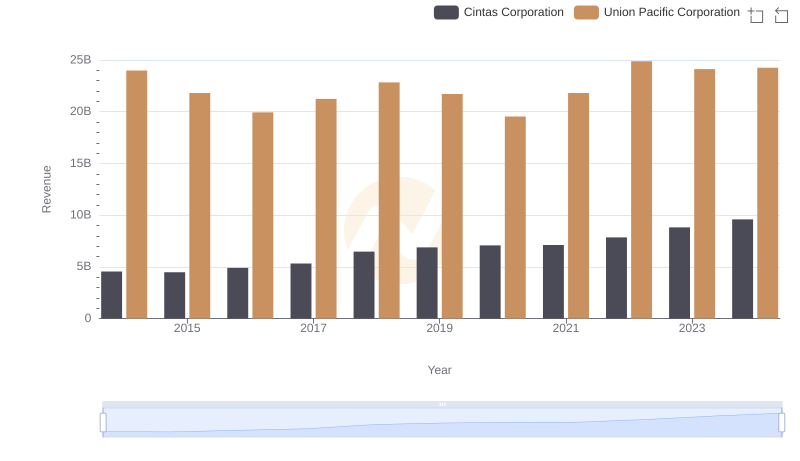
Revenue Insights: Union Pacific Corporation and Cintas Corporation Performance Compared
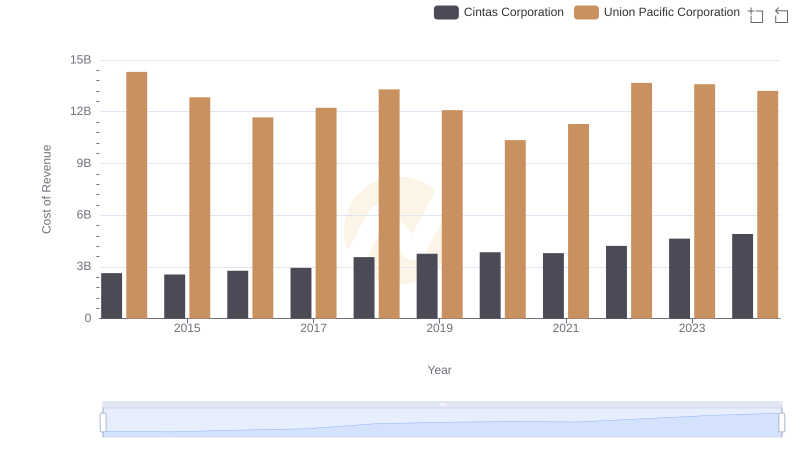
Cost of Revenue: Key Insights for Union Pacific Corporation and Cintas Corporation
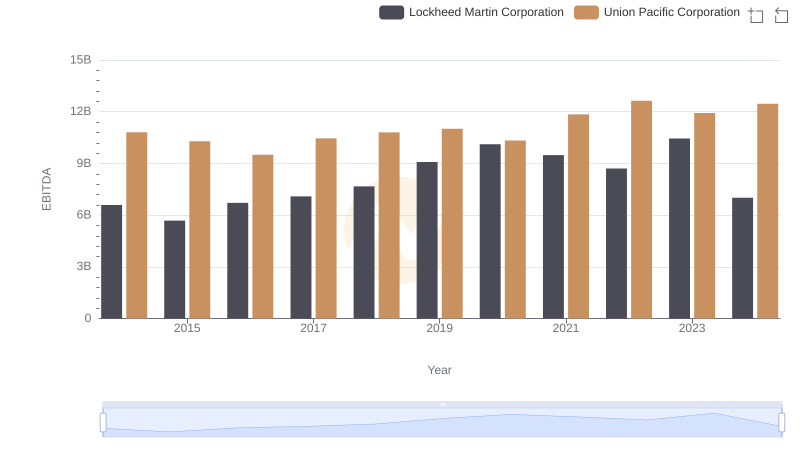
Comparative EBITDA Analysis: Union Pacific Corporation vs Lockheed Martin Corporation

EBITDA Performance Review: Union Pacific Corporation vs Deere & Company

Union Pacific Corporation vs Cintas Corporation: A Gross Profit Performance Breakdown
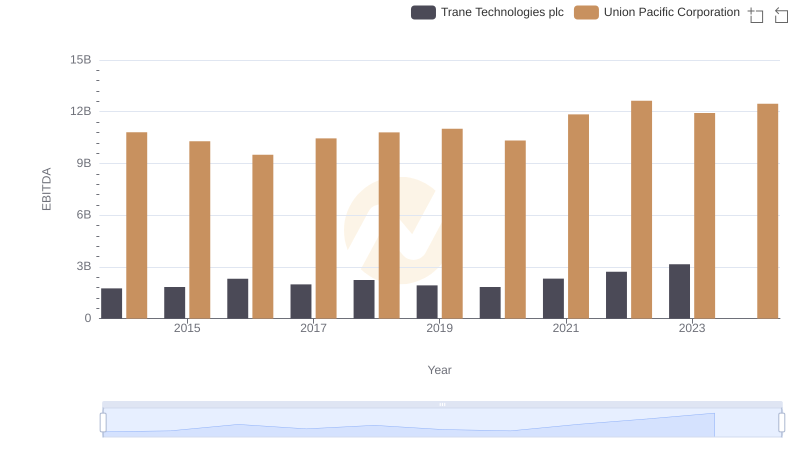
Comparative EBITDA Analysis: Union Pacific Corporation vs Trane Technologies plc