| __timestamp | Cintas Corporation | Union Pacific Corporation |
|---|---|---|
| Wednesday, January 1, 2014 | 4551812000 | 23988000000 |
| Thursday, January 1, 2015 | 4476886000 | 21813000000 |
| Friday, January 1, 2016 | 4905458000 | 19941000000 |
| Sunday, January 1, 2017 | 5323381000 | 21240000000 |
| Monday, January 1, 2018 | 6476632000 | 22832000000 |
| Tuesday, January 1, 2019 | 6892303000 | 21708000000 |
| Wednesday, January 1, 2020 | 7085120000 | 19533000000 |
| Friday, January 1, 2021 | 7116340000 | 21804000000 |
| Saturday, January 1, 2022 | 7854459000 | 24875000000 |
| Sunday, January 1, 2023 | 8815769000 | 24119000000 |
| Monday, January 1, 2024 | 9596615000 | 24250000000 |
Unleashing the power of data
In the ever-evolving landscape of American business, Union Pacific Corporation and Cintas Corporation stand as titans in their respective industries. Over the past decade, from 2014 to 2024, these companies have demonstrated remarkable revenue trajectories. Union Pacific, a stalwart in the transportation sector, has seen its revenue fluctuate, peaking in 2022 with a 27% increase from its lowest point in 2020. Meanwhile, Cintas, a leader in corporate services, has consistently grown its revenue, achieving a staggering 115% increase over the same period.
This comparison highlights the resilience and adaptability of these corporations amidst economic shifts. While Union Pacific's revenue reflects the cyclical nature of the transportation industry, Cintas showcases the steady demand for corporate services. As we look to the future, these trends offer valuable insights into the strategic directions and market dynamics shaping these industry leaders.

Breaking Down Revenue Trends: Union Pacific Corporation vs United Parcel Service, Inc.

Who Generates More Revenue? Union Pacific Corporation or Parker-Hannifin Corporation
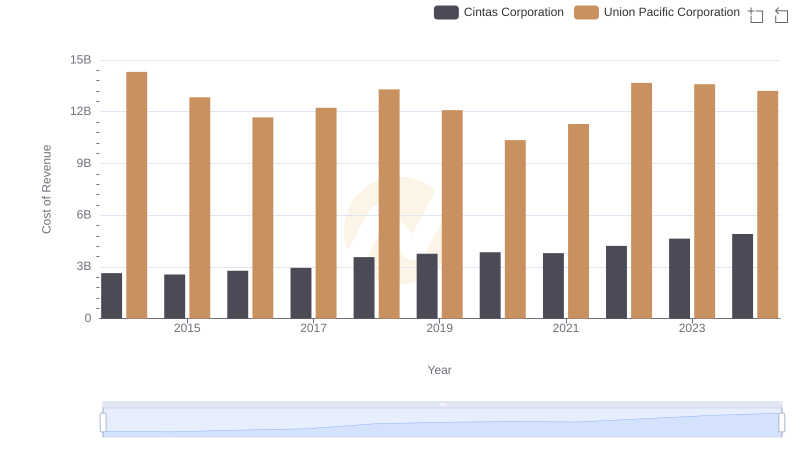
Cost of Revenue: Key Insights for Union Pacific Corporation and Cintas Corporation
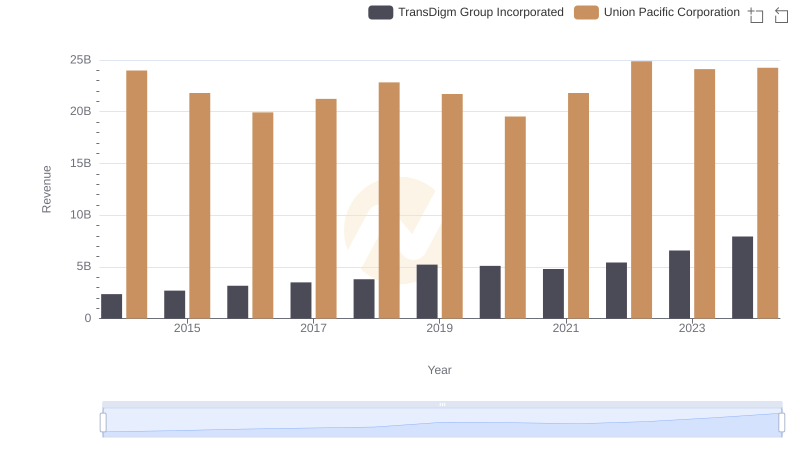
Union Pacific Corporation vs TransDigm Group Incorporated: Annual Revenue Growth Compared

Union Pacific Corporation vs Cintas Corporation: A Gross Profit Performance Breakdown
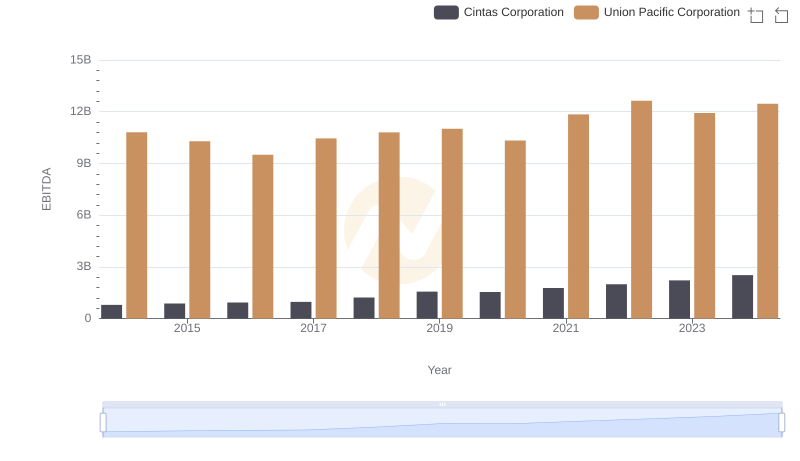
A Side-by-Side Analysis of EBITDA: Union Pacific Corporation and Cintas Corporation