| __timestamp | Trane Technologies plc | Union Pacific Corporation |
|---|---|---|
| Wednesday, January 1, 2014 | 8982800000 | 14311000000 |
| Thursday, January 1, 2015 | 9301600000 | 12837000000 |
| Friday, January 1, 2016 | 9329300000 | 11672000000 |
| Sunday, January 1, 2017 | 9811600000 | 12231000000 |
| Monday, January 1, 2018 | 10847600000 | 13293000000 |
| Tuesday, January 1, 2019 | 11451500000 | 12094000000 |
| Wednesday, January 1, 2020 | 8651300000 | 10354000000 |
| Friday, January 1, 2021 | 9666800000 | 11290000000 |
| Saturday, January 1, 2022 | 11026900000 | 13670000000 |
| Sunday, January 1, 2023 | 11820400000 | 13590000000 |
| Monday, January 1, 2024 | 12757700000 | 13211000000 |
Igniting the spark of knowledge
In the ever-evolving landscape of corporate expenses, understanding the cost dynamics of industry giants like Union Pacific Corporation and Trane Technologies plc is crucial. Over the past decade, these companies have navigated fluctuating economic conditions, with their cost of revenue reflecting broader market trends.
From 2014 to 2023, Union Pacific Corporation consistently maintained a higher cost of revenue compared to Trane Technologies, peaking in 2014 with a 43% higher cost. However, Trane Technologies showed resilience, with a notable 37% increase in cost of revenue from 2014 to 2023, indicating strategic investments and growth.
Despite a dip in 2020, likely due to global disruptions, both companies rebounded by 2023. Interestingly, data for 2024 is incomplete, suggesting ongoing financial adjustments. This analysis underscores the importance of strategic cost management in sustaining competitive advantage.
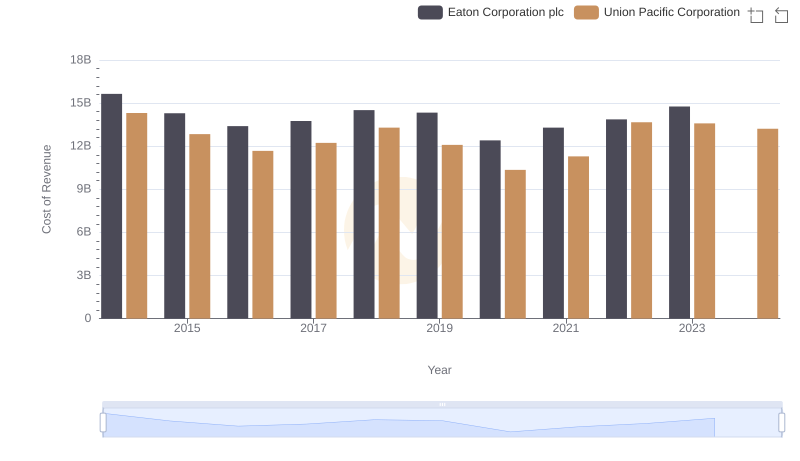
Comparing Cost of Revenue Efficiency: Union Pacific Corporation vs Eaton Corporation plc
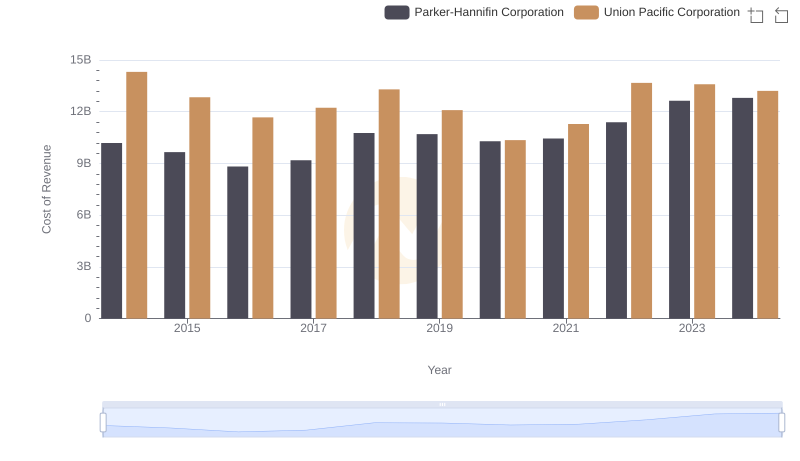
Union Pacific Corporation vs Parker-Hannifin Corporation: Efficiency in Cost of Revenue Explored
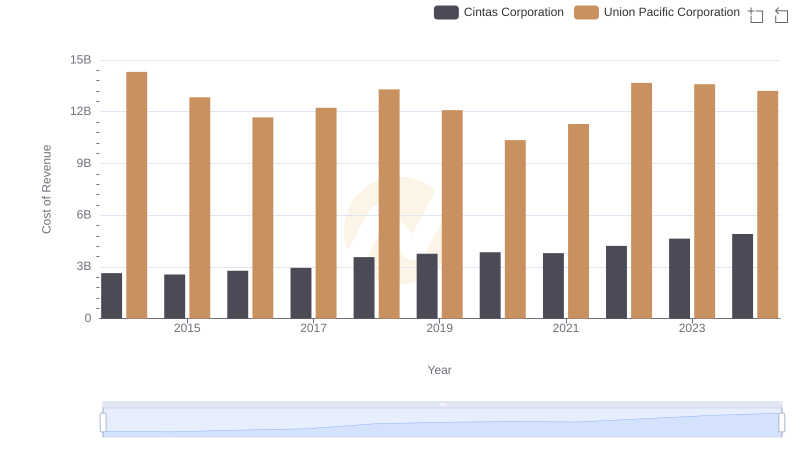
Cost of Revenue: Key Insights for Union Pacific Corporation and Cintas Corporation
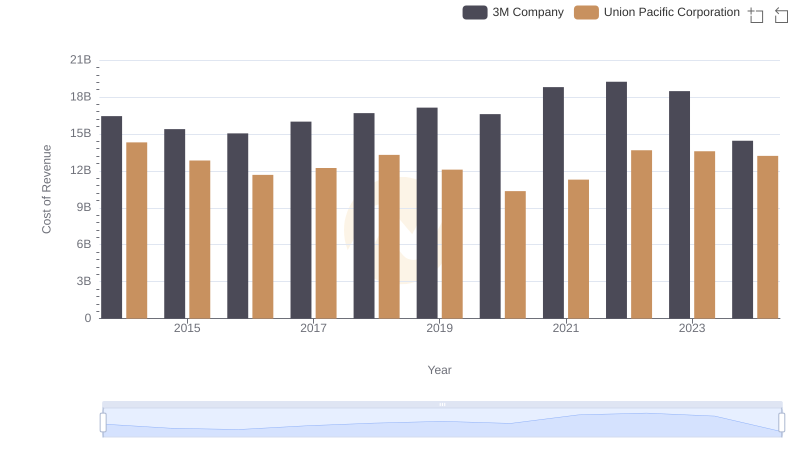
Cost of Revenue: Key Insights for Union Pacific Corporation and 3M Company
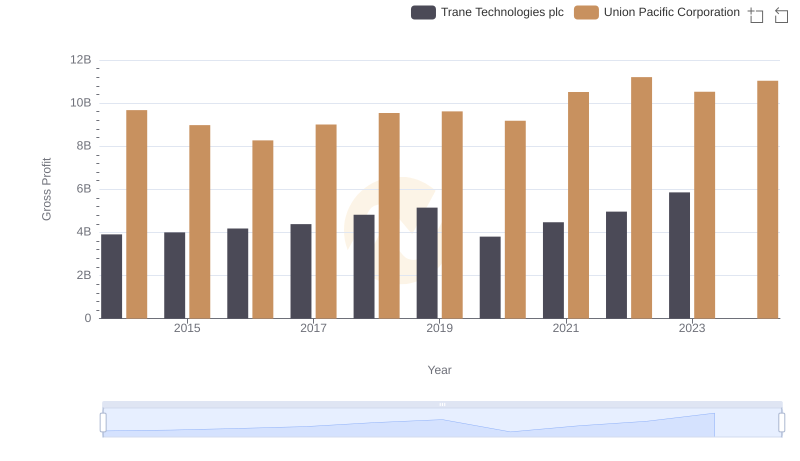
Union Pacific Corporation vs Trane Technologies plc: A Gross Profit Performance Breakdown
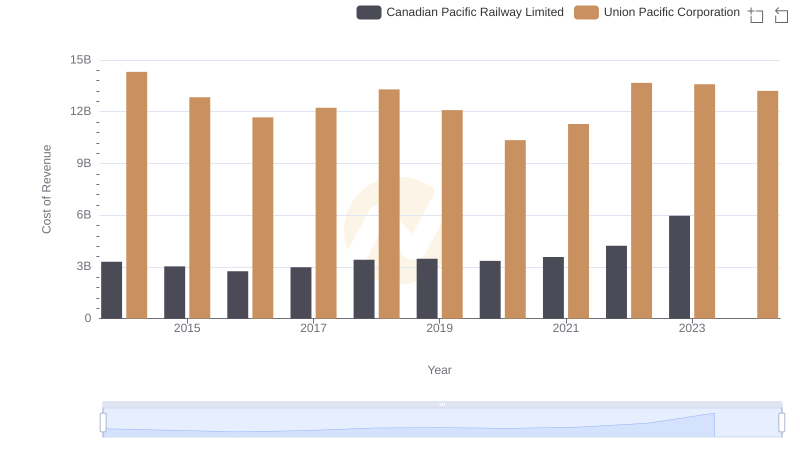
Analyzing Cost of Revenue: Union Pacific Corporation and Canadian Pacific Railway Limited
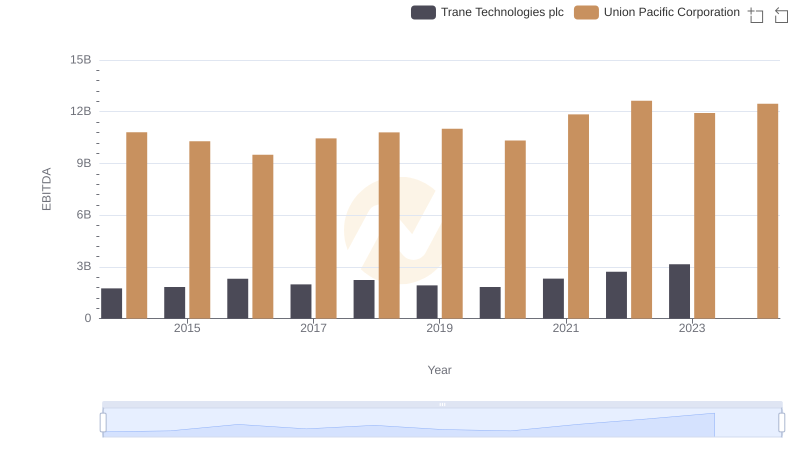
Comparative EBITDA Analysis: Union Pacific Corporation vs Trane Technologies plc