| __timestamp | Canadian Pacific Railway Limited | Union Pacific Corporation |
|---|---|---|
| Wednesday, January 1, 2014 | 3300000000 | 14311000000 |
| Thursday, January 1, 2015 | 3032000000 | 12837000000 |
| Friday, January 1, 2016 | 2749000000 | 11672000000 |
| Sunday, January 1, 2017 | 2979000000 | 12231000000 |
| Monday, January 1, 2018 | 3413000000 | 13293000000 |
| Tuesday, January 1, 2019 | 3475000000 | 12094000000 |
| Wednesday, January 1, 2020 | 3349000000 | 10354000000 |
| Friday, January 1, 2021 | 3571000000 | 11290000000 |
| Saturday, January 1, 2022 | 4223000000 | 13670000000 |
| Sunday, January 1, 2023 | 5968000000 | 13590000000 |
| Monday, January 1, 2024 | 7003000000 | 13211000000 |
Unleashing insights
In the world of rail transportation, Union Pacific Corporation and Canadian Pacific Railway Limited have long been titans. Over the past decade, their financial journeys have been marked by significant shifts in cost of revenue. Union Pacific, with a consistent lead, saw its cost of revenue peak in 2014, only to experience a gradual decline of about 8% by 2023. Meanwhile, Canadian Pacific's cost of revenue surged by nearly 80% from 2014 to 2023, reflecting strategic investments and operational changes.
Union Pacific's cost efficiency is evident, maintaining a relatively stable cost structure. In contrast, Canadian Pacific's rising costs suggest aggressive expansion or modernization efforts. The data for 2024 is incomplete, hinting at potential shifts in the coming year. These insights offer a glimpse into the strategic directions of these rail giants, providing valuable context for investors and industry analysts alike.
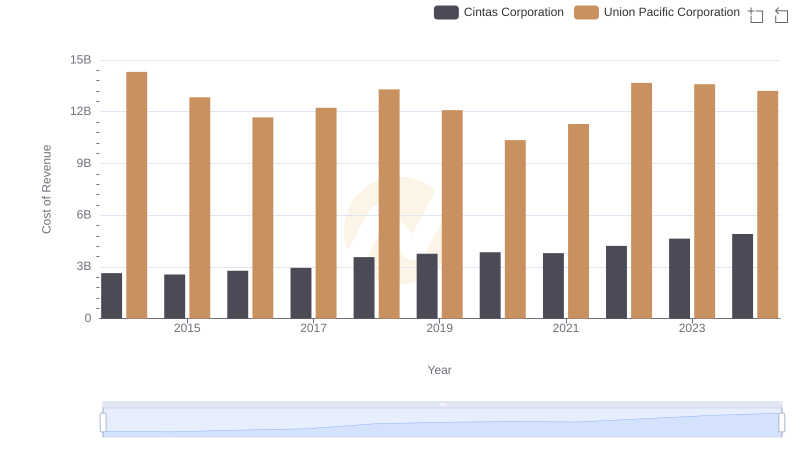
Cost of Revenue: Key Insights for Union Pacific Corporation and Cintas Corporation
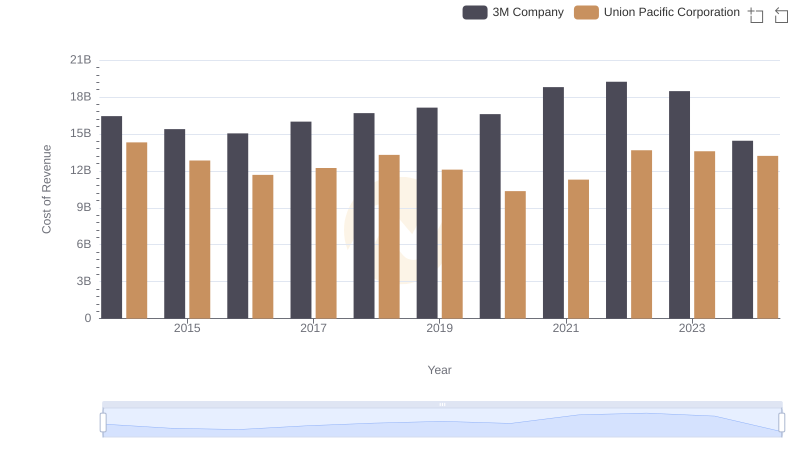
Cost of Revenue: Key Insights for Union Pacific Corporation and 3M Company
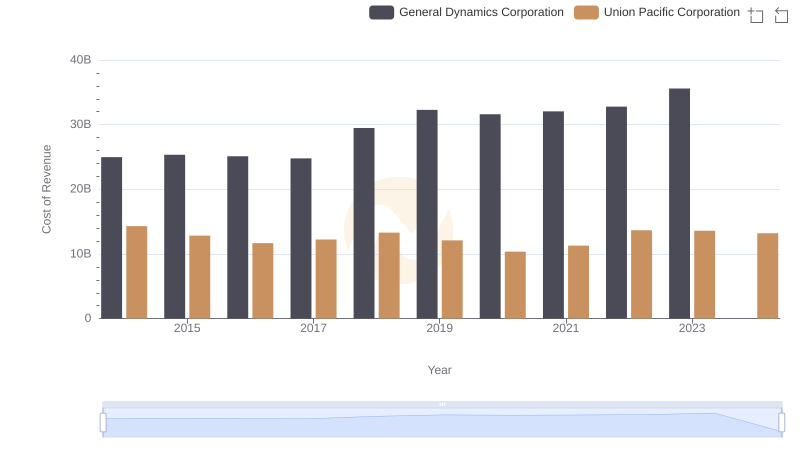
Cost of Revenue Comparison: Union Pacific Corporation vs General Dynamics Corporation
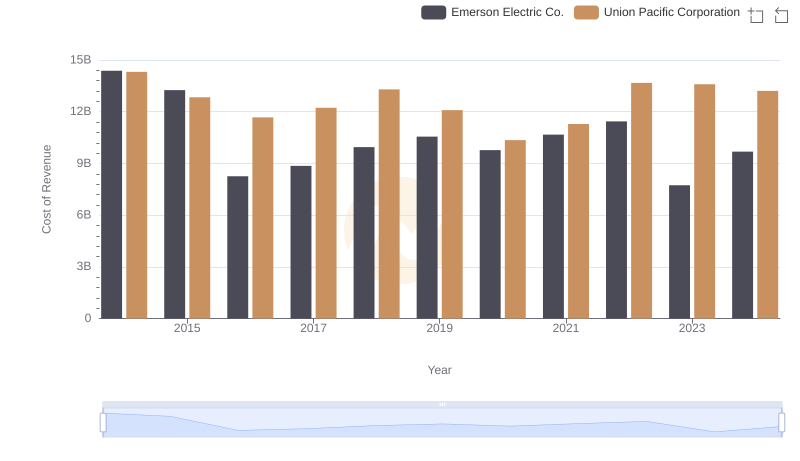
Cost of Revenue Trends: Union Pacific Corporation vs Emerson Electric Co.