| __timestamp | Dover Corporation | Trane Technologies plc |
|---|---|---|
| Wednesday, January 1, 2014 | 1533084000 | 1757000000 |
| Thursday, January 1, 2015 | 1259375000 | 1835000000 |
| Friday, January 1, 2016 | 1186472000 | 2311000000 |
| Sunday, January 1, 2017 | 1304041000 | 1982500000 |
| Monday, January 1, 2018 | 1138930000 | 2242400000 |
| Tuesday, January 1, 2019 | 1241114000 | 1931200000 |
| Wednesday, January 1, 2020 | 1232722000 | 1831900000 |
| Friday, January 1, 2021 | 1797268000 | 2319200000 |
| Saturday, January 1, 2022 | 1711499000 | 2715500000 |
| Sunday, January 1, 2023 | 1718774000 | 3149900000 |
| Monday, January 1, 2024 | 1206355000 | 3859600000 |
Unlocking the unknown
In the ever-evolving landscape of industrial innovation, Trane Technologies plc and Dover Corporation have emerged as formidable players. Over the past decade, from 2014 to 2023, these companies have demonstrated remarkable growth in their EBITDA, a key indicator of financial health and operational efficiency.
Trane Technologies has consistently outperformed Dover Corporation, with an average EBITDA of approximately $2.2 billion, compared to Dover's $1.4 billion. Notably, Trane Technologies saw a staggering 79% increase in EBITDA from 2014 to 2023, peaking at $3.15 billion in 2023. Meanwhile, Dover Corporation experienced a more modest growth of 12%, reaching $1.72 billion in the same year.
This side-by-side analysis highlights the strategic prowess of Trane Technologies in capitalizing on market opportunities, while Dover Corporation maintains steady progress. As we look to the future, these trends offer valuable insights into the competitive dynamics of the industrial sector.
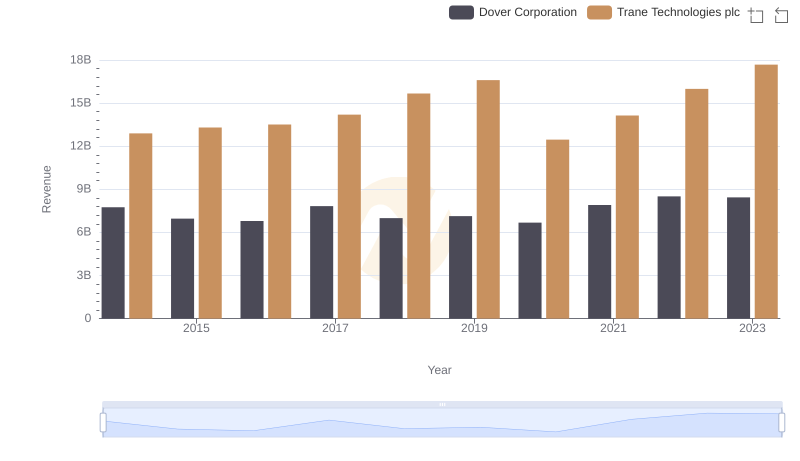
Annual Revenue Comparison: Trane Technologies plc vs Dover Corporation
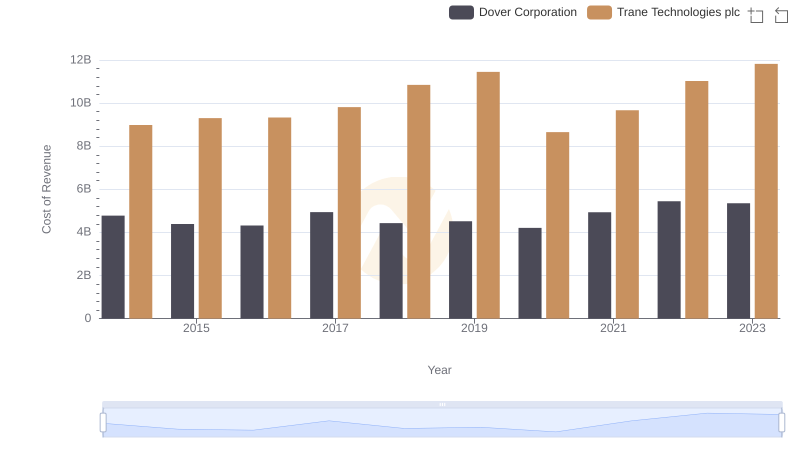
Cost of Revenue: Key Insights for Trane Technologies plc and Dover Corporation
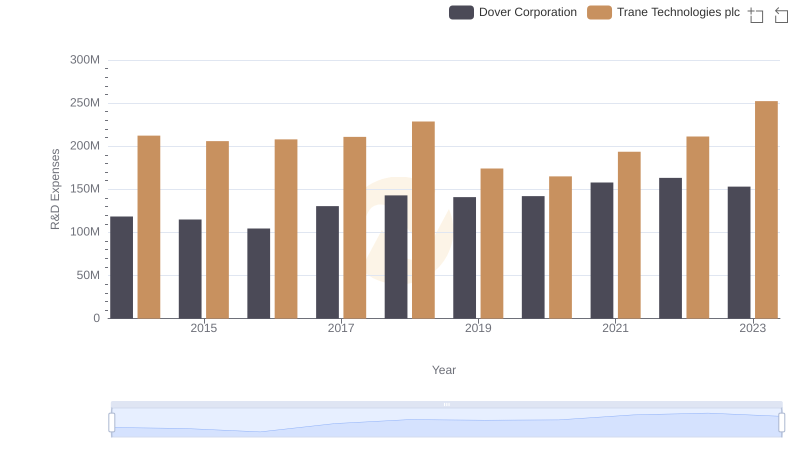
Trane Technologies plc vs Dover Corporation: Strategic Focus on R&D Spending
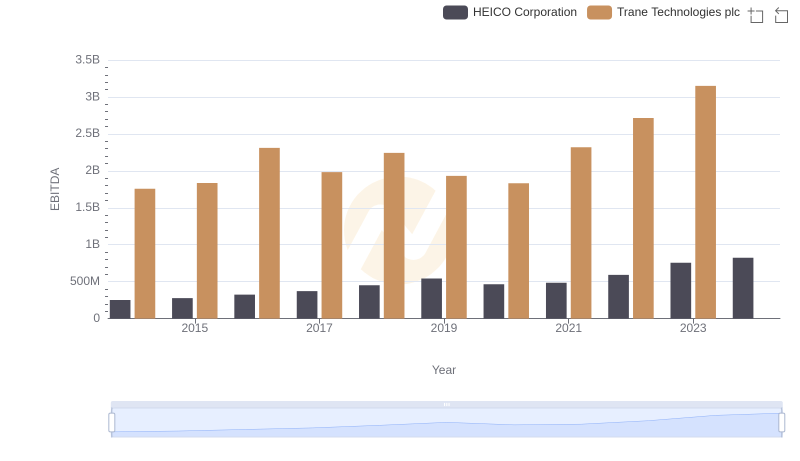
A Professional Review of EBITDA: Trane Technologies plc Compared to HEICO Corporation
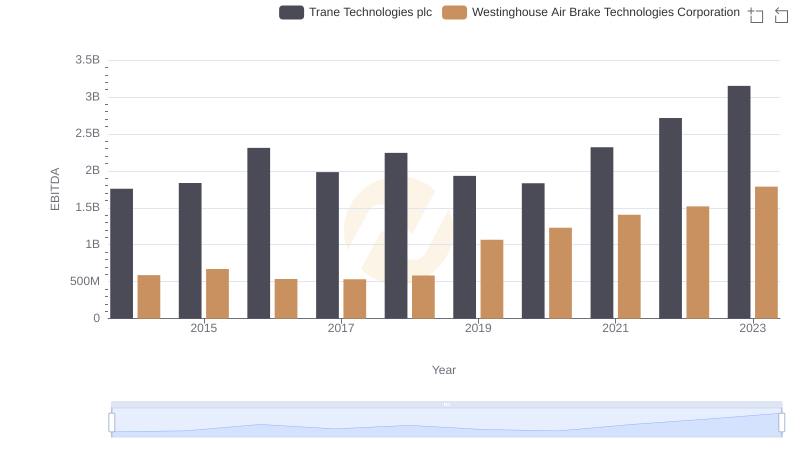
EBITDA Analysis: Evaluating Trane Technologies plc Against Westinghouse Air Brake Technologies Corporation
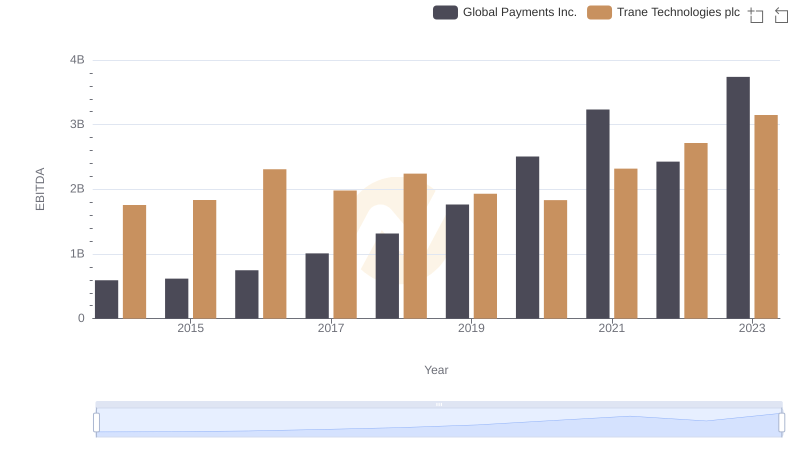
Comparative EBITDA Analysis: Trane Technologies plc vs Global Payments Inc.
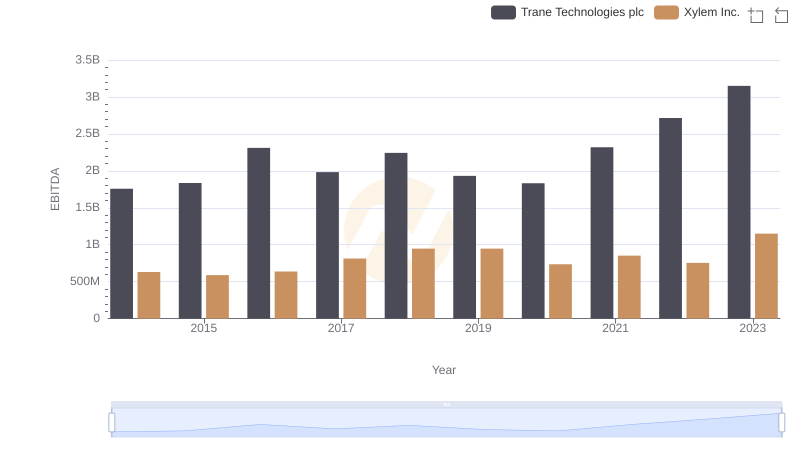
A Professional Review of EBITDA: Trane Technologies plc Compared to Xylem Inc.
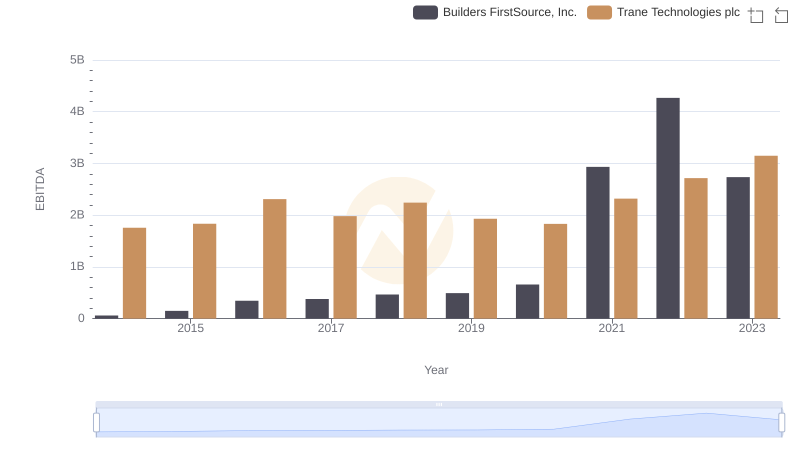
EBITDA Metrics Evaluated: Trane Technologies plc vs Builders FirstSource, Inc.
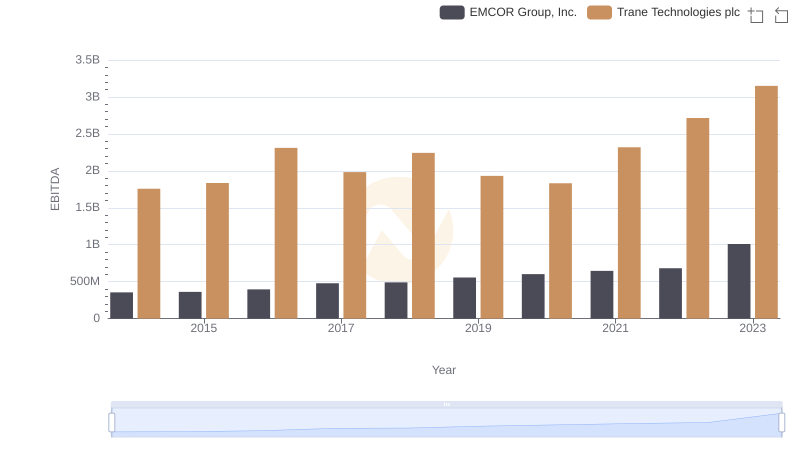
A Professional Review of EBITDA: Trane Technologies plc Compared to EMCOR Group, Inc.
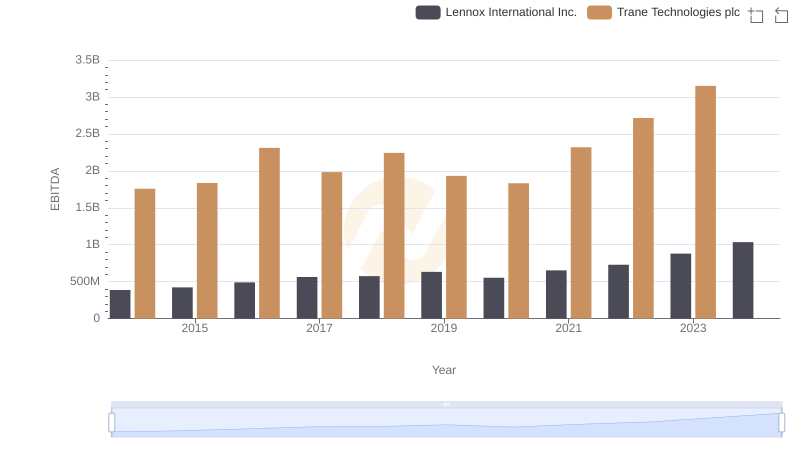
EBITDA Analysis: Evaluating Trane Technologies plc Against Lennox International Inc.