| __timestamp | Hubbell Incorporated | Old Dominion Freight Line, Inc. |
|---|---|---|
| Wednesday, January 1, 2014 | 594700000 | 585590000 |
| Thursday, January 1, 2015 | 533600000 | 660570000 |
| Friday, January 1, 2016 | 564700000 | 671786000 |
| Sunday, January 1, 2017 | 585600000 | 783749000 |
| Monday, January 1, 2018 | 677500000 | 1046059000 |
| Tuesday, January 1, 2019 | 740900000 | 1078007000 |
| Wednesday, January 1, 2020 | 671400000 | 1168149000 |
| Friday, January 1, 2021 | 661000000 | 1651501000 |
| Saturday, January 1, 2022 | 854300000 | 2118962000 |
| Sunday, January 1, 2023 | 1169700000 | 1972689000 |
| Monday, January 1, 2024 | 1291200000 |
Unveiling the hidden dimensions of data
In the competitive landscape of the transportation and electrical products industries, Old Dominion Freight Line, Inc. and Hubbell Incorporated have demonstrated remarkable financial resilience over the past decade. From 2014 to 2023, Old Dominion's EBITDA surged by an impressive 237%, reflecting its strategic expansion and operational efficiency. Meanwhile, Hubbell Incorporated, a stalwart in the electrical products sector, saw its EBITDA grow by approximately 97% during the same period.
This financial journey underscores the dynamic nature of these industries and the strategic prowess of these companies.
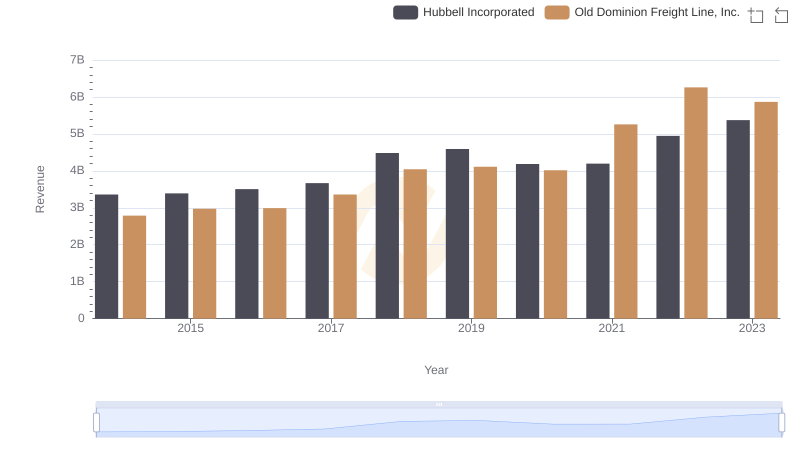
Old Dominion Freight Line, Inc. or Hubbell Incorporated: Who Leads in Yearly Revenue?
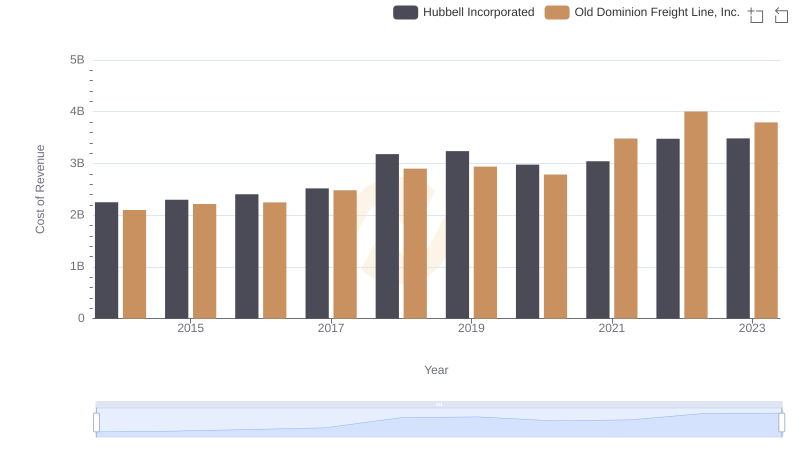
Cost of Revenue: Key Insights for Old Dominion Freight Line, Inc. and Hubbell Incorporated
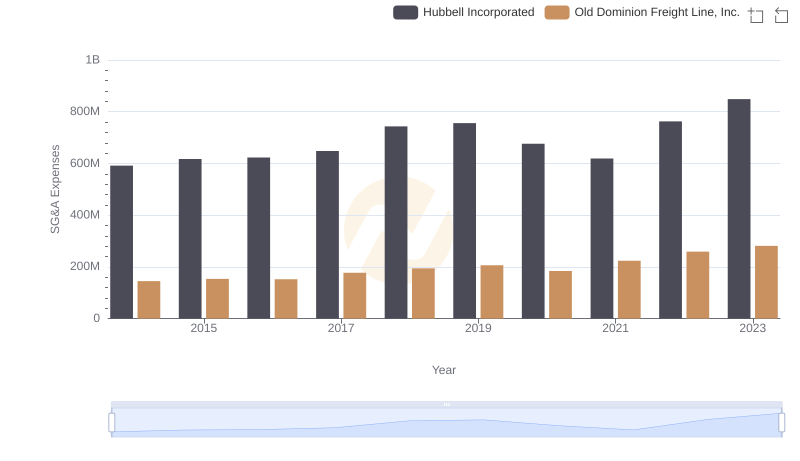
SG&A Efficiency Analysis: Comparing Old Dominion Freight Line, Inc. and Hubbell Incorporated
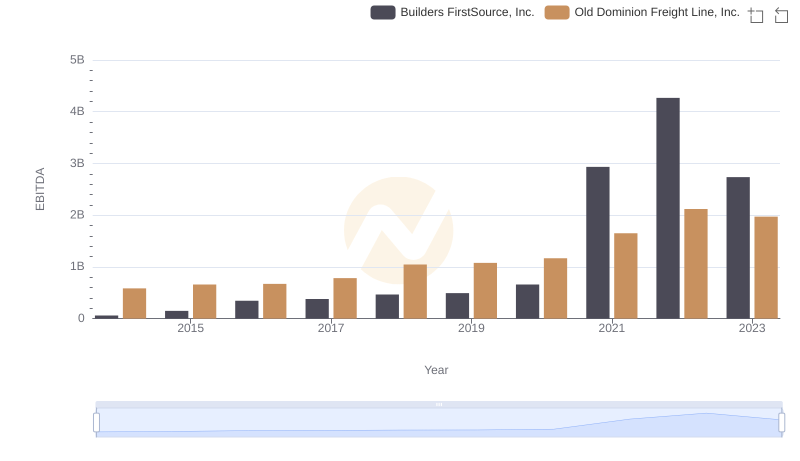
Comprehensive EBITDA Comparison: Old Dominion Freight Line, Inc. vs Builders FirstSource, Inc.
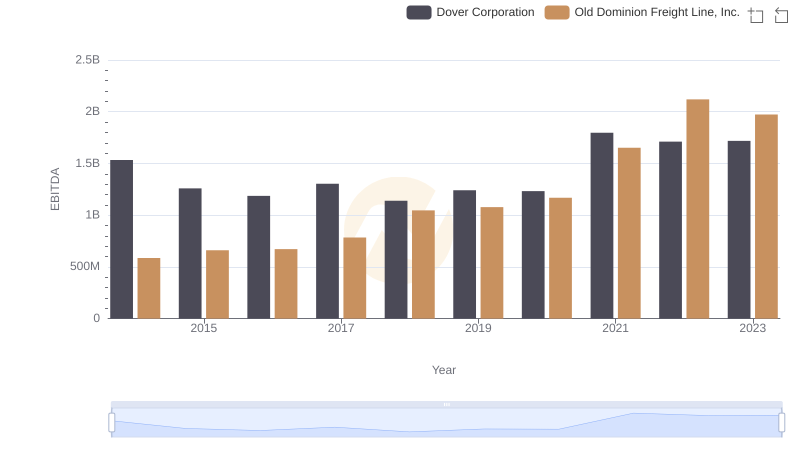
EBITDA Performance Review: Old Dominion Freight Line, Inc. vs Dover Corporation
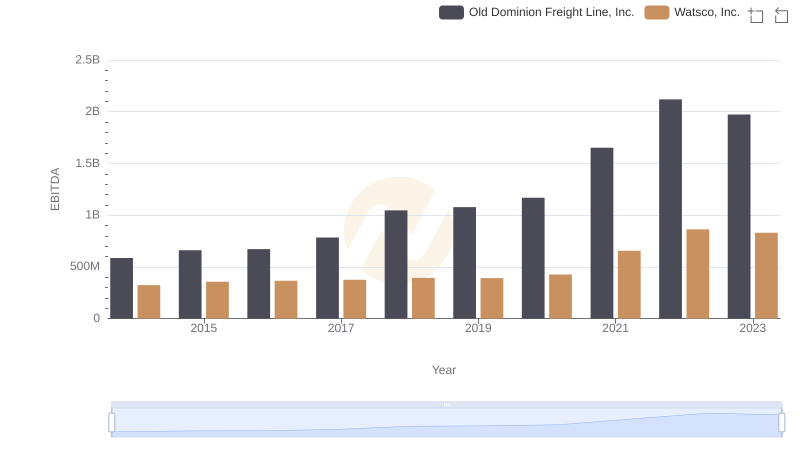
Old Dominion Freight Line, Inc. and Watsco, Inc.: A Detailed Examination of EBITDA Performance
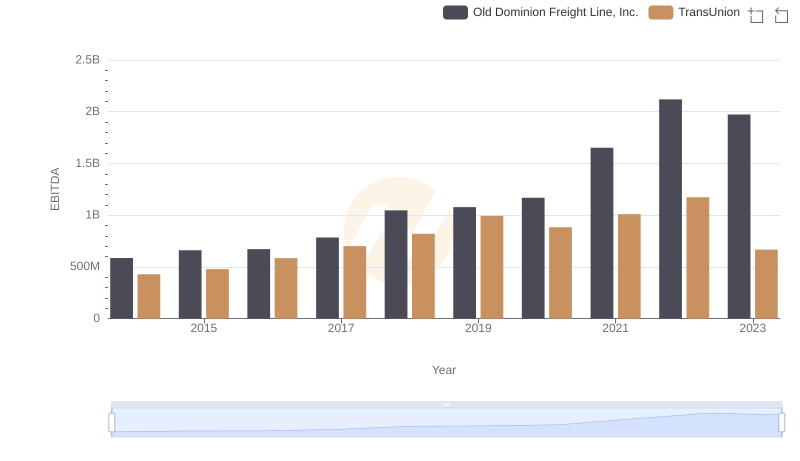
A Side-by-Side Analysis of EBITDA: Old Dominion Freight Line, Inc. and TransUnion
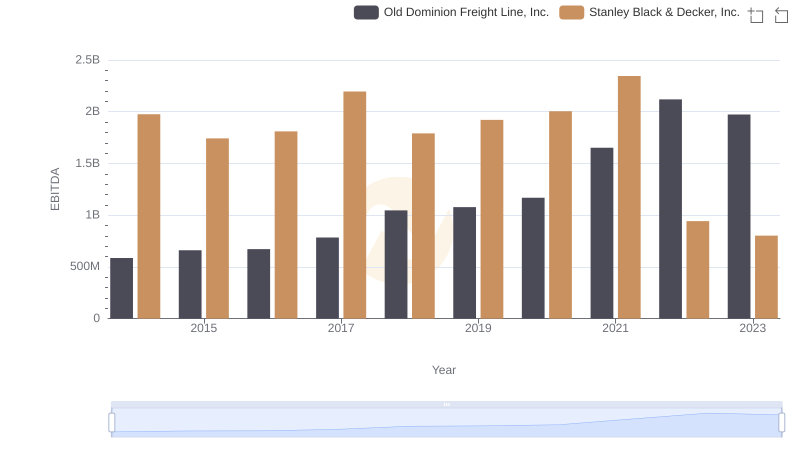
Old Dominion Freight Line, Inc. vs Stanley Black & Decker, Inc.: In-Depth EBITDA Performance Comparison