| __timestamp | AECOM | Old Dominion Freight Line, Inc. |
|---|---|---|
| Wednesday, January 1, 2014 | 403176000 | 687488000 |
| Thursday, January 1, 2015 | 535188000 | 757499000 |
| Friday, January 1, 2016 | 642824000 | 744627000 |
| Sunday, January 1, 2017 | 683720000 | 875380000 |
| Monday, January 1, 2018 | 650649000 | 1144243000 |
| Tuesday, January 1, 2019 | 813445000 | 1170216000 |
| Wednesday, January 1, 2020 | 709560000 | 1228598000 |
| Friday, January 1, 2021 | 798421000 | 1775060000 |
| Saturday, January 1, 2022 | 847974000 | 2256126000 |
| Sunday, January 1, 2023 | 945465000 | 2072199000 |
| Monday, January 1, 2024 | 1084341000 |
In pursuit of knowledge
In the competitive landscape of logistics and engineering, Old Dominion Freight Line, Inc. and AECOM have shown distinct trajectories in gross profit over the past decade. Since 2014, Old Dominion Freight Line has consistently outperformed AECOM, with a notable peak in 2022, where its gross profit was approximately 166% higher than AECOM's. This trend highlights Old Dominion's robust growth strategy and operational efficiency.
AECOM, while trailing, has demonstrated steady growth, achieving a 169% increase in gross profit from 2014 to 2024. However, the data for Old Dominion in 2024 is missing, leaving room for speculation on its continued dominance. This analysis underscores the dynamic nature of these industries and the importance of strategic financial management.
Stay tuned as we delve deeper into the factors driving these trends and what they mean for the future of these industry giants.
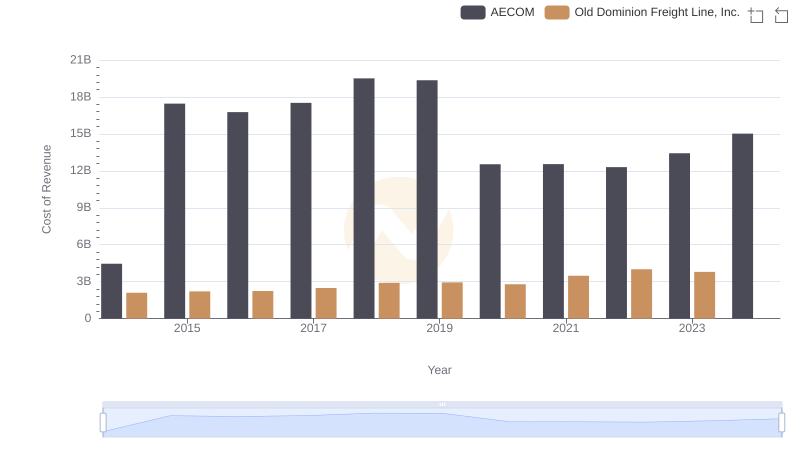
Cost of Revenue: Key Insights for Old Dominion Freight Line, Inc. and AECOM
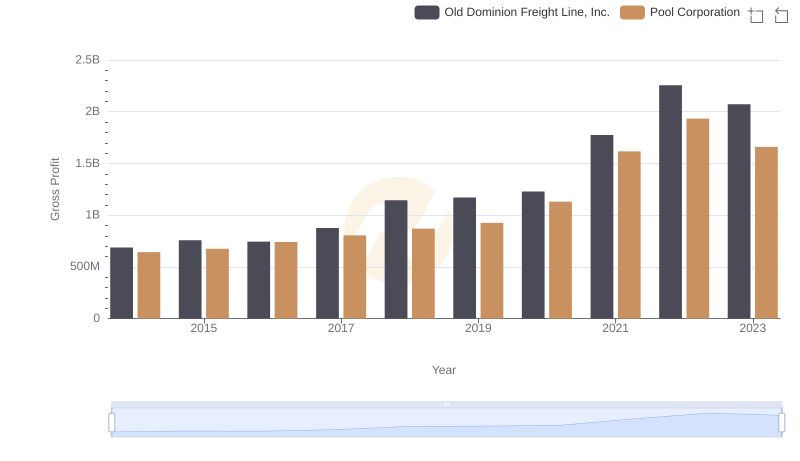
Old Dominion Freight Line, Inc. vs Pool Corporation: A Gross Profit Performance Breakdown
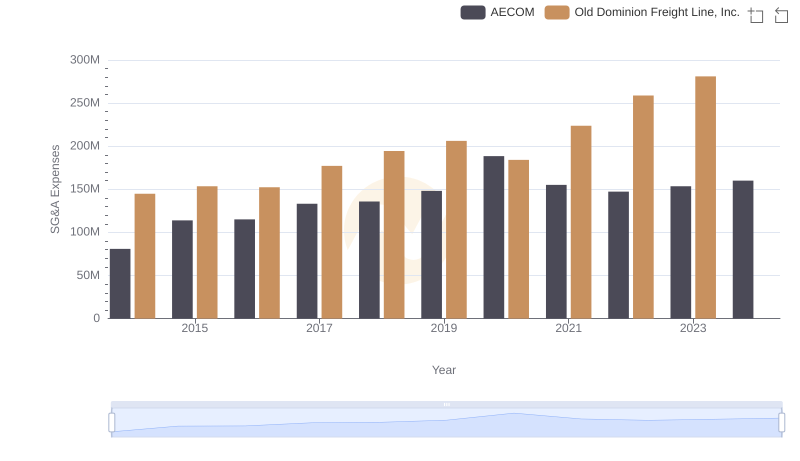
Comparing SG&A Expenses: Old Dominion Freight Line, Inc. vs AECOM Trends and Insights
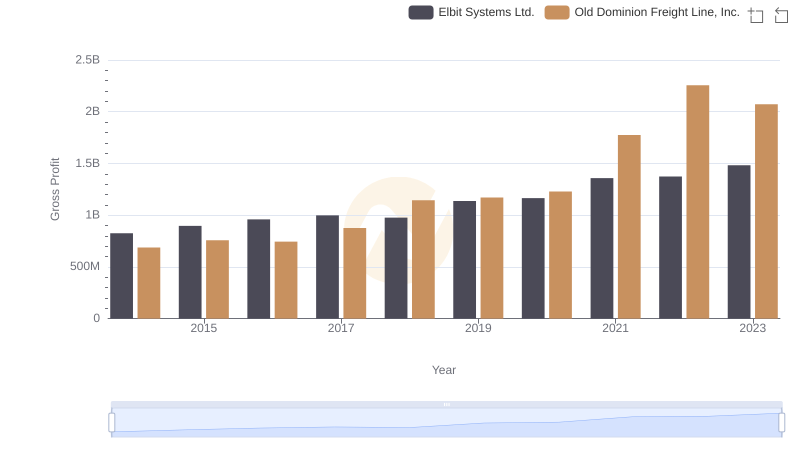
Gross Profit Trends Compared: Old Dominion Freight Line, Inc. vs Elbit Systems Ltd.
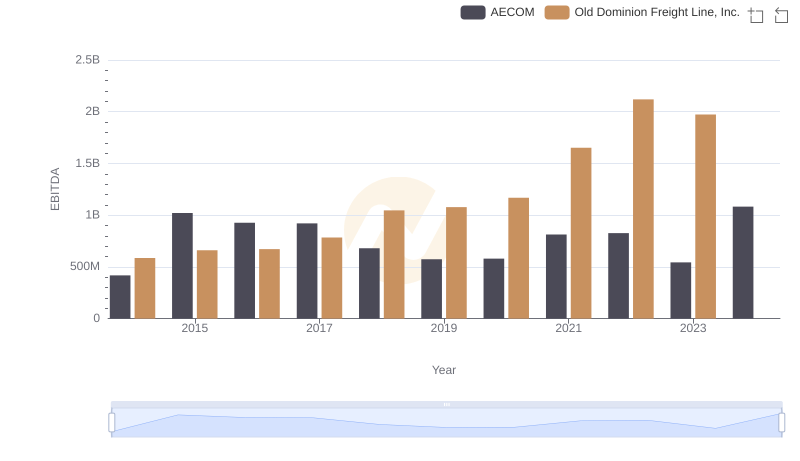
Old Dominion Freight Line, Inc. and AECOM: A Detailed Examination of EBITDA Performance