| __timestamp | Comfort Systems USA, Inc. | Ingersoll Rand Inc. |
|---|---|---|
| Wednesday, January 1, 2014 | 1161024000 | 1633224000 |
| Thursday, January 1, 2015 | 1262390000 | 1347800000 |
| Friday, January 1, 2016 | 1290331000 | 1222705000 |
| Sunday, January 1, 2017 | 1421641000 | 1477500000 |
| Monday, January 1, 2018 | 1736600000 | 1677300000 |
| Tuesday, January 1, 2019 | 2113334000 | 1540200000 |
| Wednesday, January 1, 2020 | 2309676000 | 3296800000 |
| Friday, January 1, 2021 | 2510429000 | 3163900000 |
| Saturday, January 1, 2022 | 3398756000 | 3590700000 |
| Sunday, January 1, 2023 | 4216251000 | 3993900000 |
| Monday, January 1, 2024 | 0 |
Infusing magic into the data realm
In the ever-evolving landscape of industrial and comfort systems, understanding cost dynamics is crucial. Over the past decade, from 2014 to 2023, Ingersoll Rand Inc. and Comfort Systems USA, Inc. have shown intriguing trends in their cost of revenue. Comfort Systems USA, Inc. has seen a remarkable increase of approximately 263% in its cost of revenue, peaking at $4.2 billion in 2023. Meanwhile, Ingersoll Rand Inc. experienced a 145% rise, reaching nearly $4 billion in the same year. Notably, 2020 marked a significant surge for Ingersoll Rand, with costs jumping by 114% compared to the previous year. This data highlights the dynamic nature of cost management in these industries, reflecting broader economic trends and company-specific strategies. As businesses navigate these financial waters, understanding these patterns becomes essential for stakeholders and investors alike.
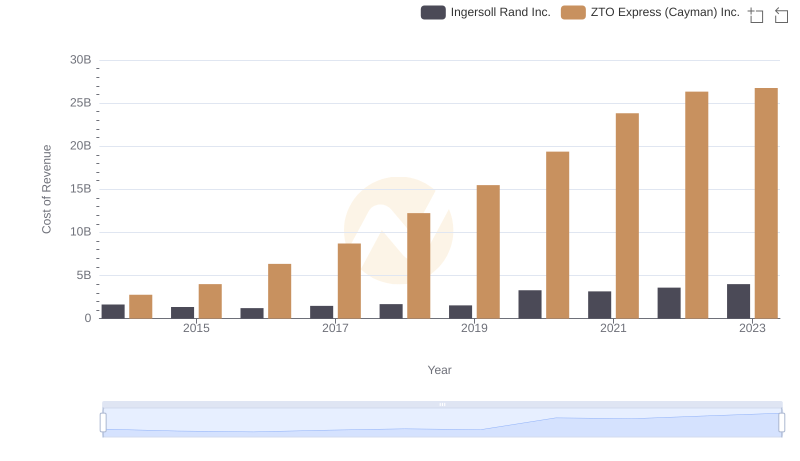
Ingersoll Rand Inc. vs ZTO Express (Cayman) Inc.: Efficiency in Cost of Revenue Explored
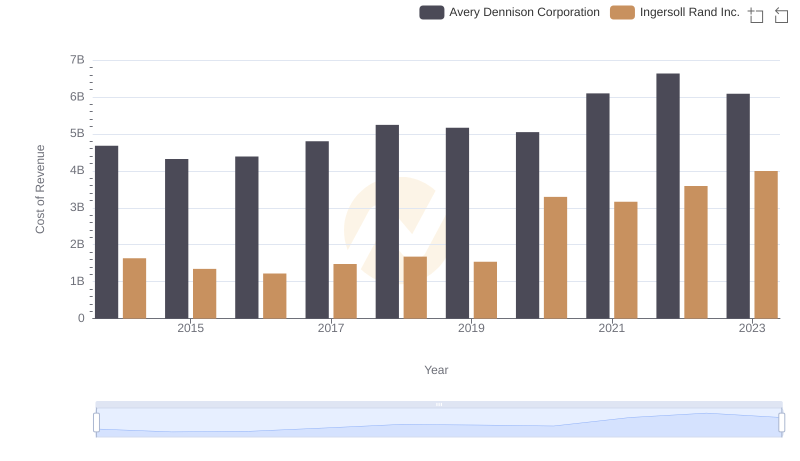
Analyzing Cost of Revenue: Ingersoll Rand Inc. and Avery Dennison Corporation
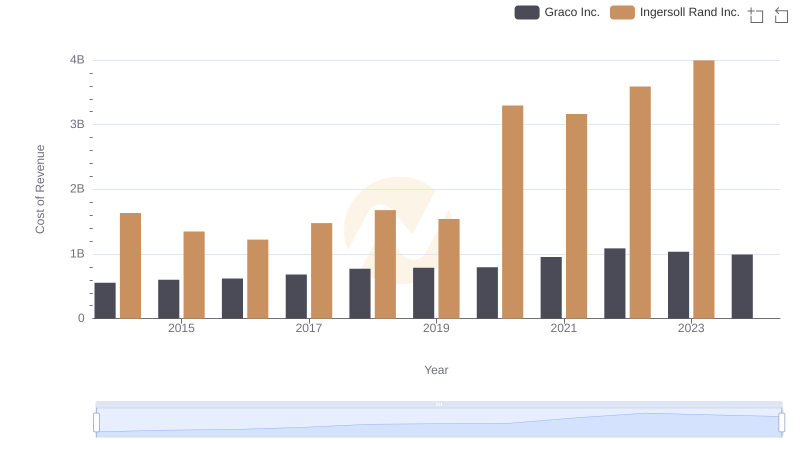
Cost of Revenue Comparison: Ingersoll Rand Inc. vs Graco Inc.
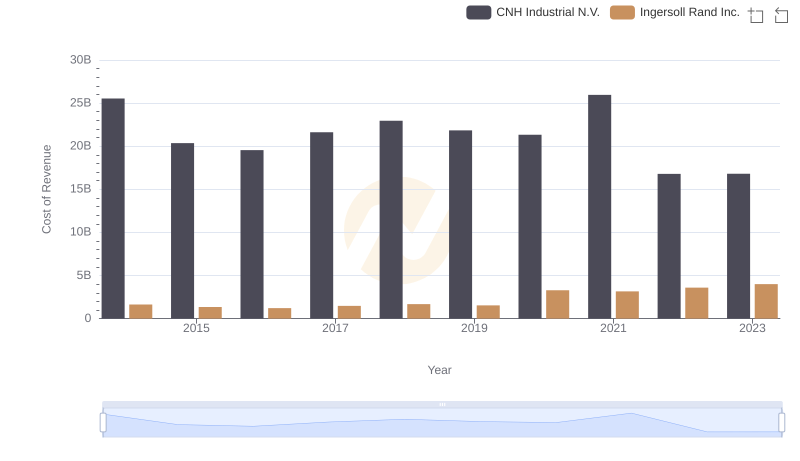
Cost of Revenue Trends: Ingersoll Rand Inc. vs CNH Industrial N.V.
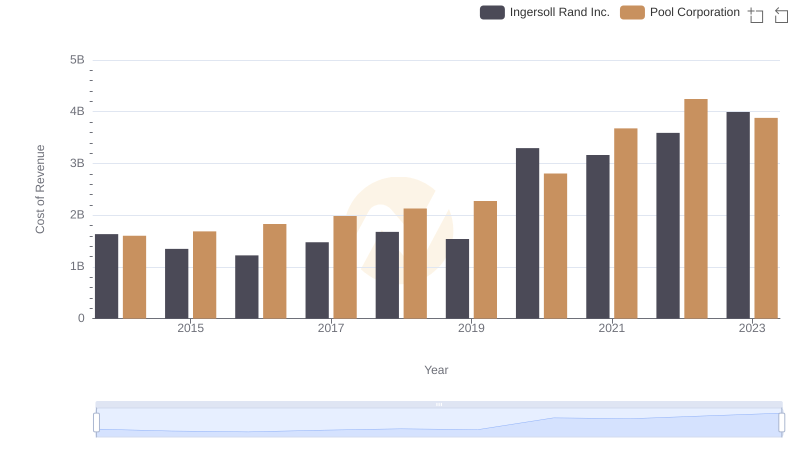
Cost Insights: Breaking Down Ingersoll Rand Inc. and Pool Corporation's Expenses
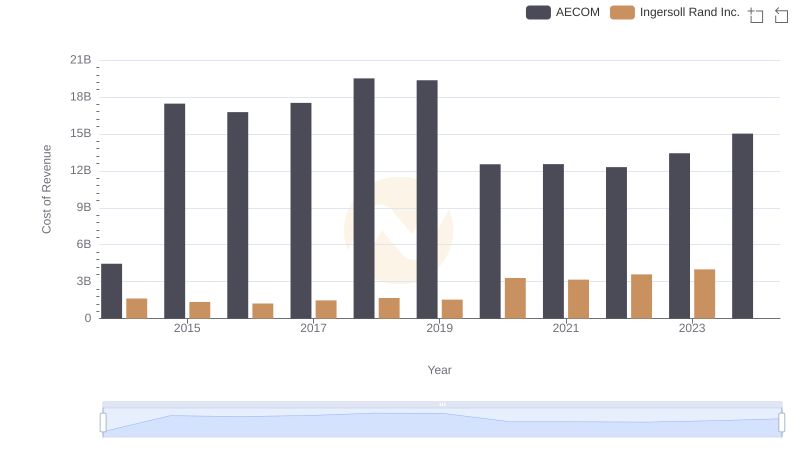
Cost Insights: Breaking Down Ingersoll Rand Inc. and AECOM's Expenses
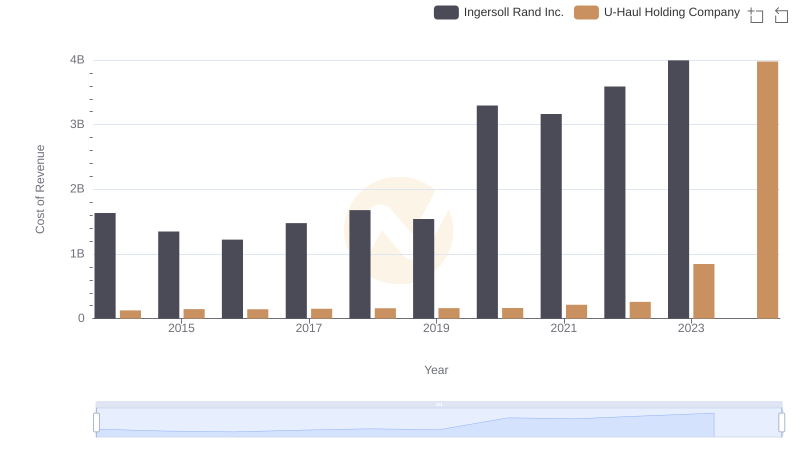
Ingersoll Rand Inc. vs U-Haul Holding Company: Efficiency in Cost of Revenue Explored
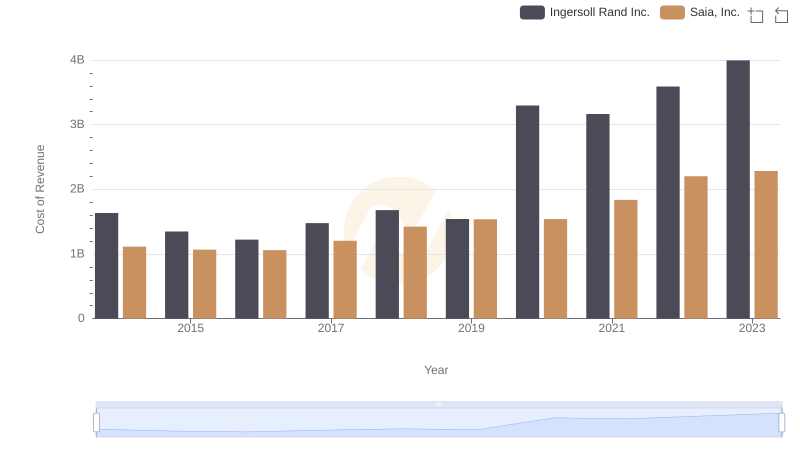
Cost of Revenue: Key Insights for Ingersoll Rand Inc. and Saia, Inc.
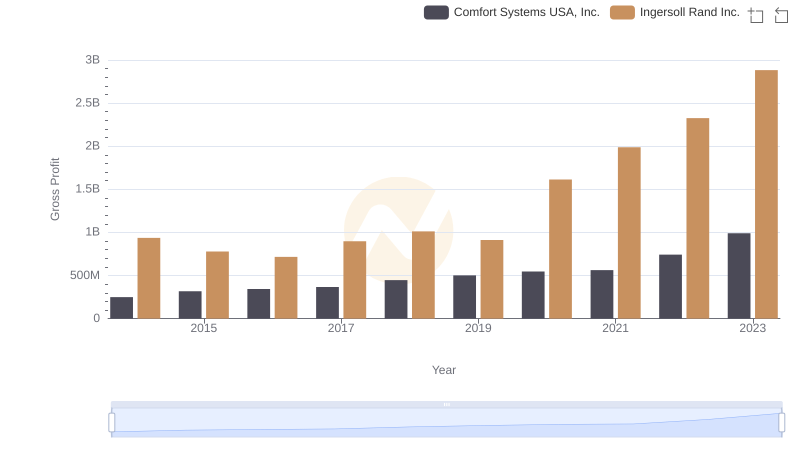
Key Insights on Gross Profit: Ingersoll Rand Inc. vs Comfort Systems USA, Inc.
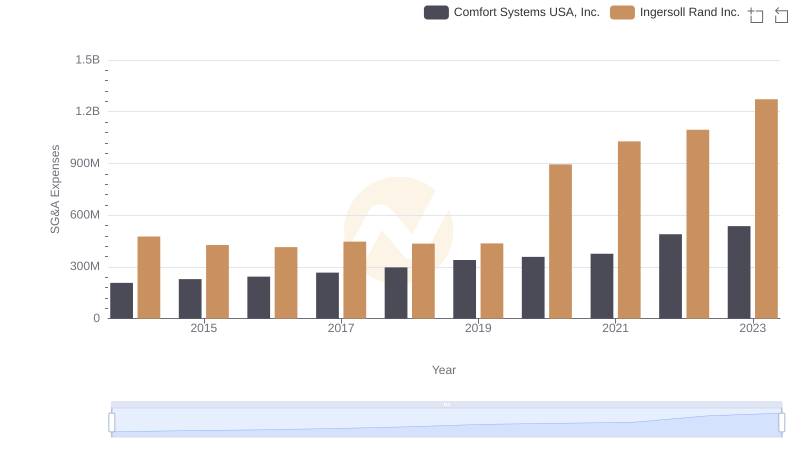
Cost Management Insights: SG&A Expenses for Ingersoll Rand Inc. and Comfort Systems USA, Inc.