| __timestamp | CNH Industrial N.V. | Ingersoll Rand Inc. |
|---|---|---|
| Wednesday, January 1, 2014 | 25534000000 | 1633224000 |
| Thursday, January 1, 2015 | 20357000000 | 1347800000 |
| Friday, January 1, 2016 | 19539000000 | 1222705000 |
| Sunday, January 1, 2017 | 21621000000 | 1477500000 |
| Monday, January 1, 2018 | 22958000000 | 1677300000 |
| Tuesday, January 1, 2019 | 21832000000 | 1540200000 |
| Wednesday, January 1, 2020 | 21327000000 | 3296800000 |
| Friday, January 1, 2021 | 25951000000 | 3163900000 |
| Saturday, January 1, 2022 | 16797000000 | 3590700000 |
| Sunday, January 1, 2023 | 16805000000 | 3993900000 |
| Monday, January 1, 2024 | 0 |
Cracking the code
In the ever-evolving landscape of industrial manufacturing, Ingersoll Rand Inc. and CNH Industrial N.V. have been pivotal players. Over the past decade, these companies have showcased contrasting trends in their cost of revenue. From 2014 to 2023, CNH Industrial N.V. experienced a 34% decline in cost of revenue, dropping from its peak in 2014. In contrast, Ingersoll Rand Inc. saw a remarkable 145% increase, highlighting its strategic growth and operational efficiency.
In 2020, Ingersoll Rand Inc. made a significant leap, nearly doubling its cost of revenue compared to the previous year, a testament to its aggressive expansion strategies. Meanwhile, CNH Industrial N.V. faced a downturn, with its cost of revenue in 2022 and 2023 being the lowest in the decade. This divergence underscores the dynamic nature of the industrial sector and the varied strategies employed by these industry titans.
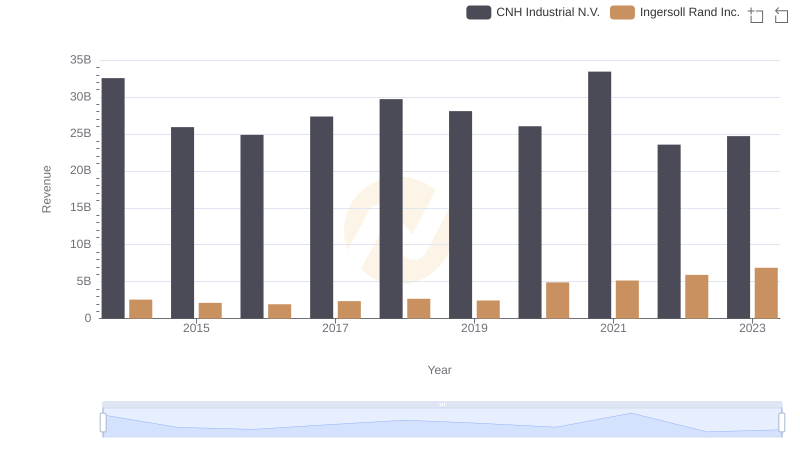
Ingersoll Rand Inc. vs CNH Industrial N.V.: Annual Revenue Growth Compared
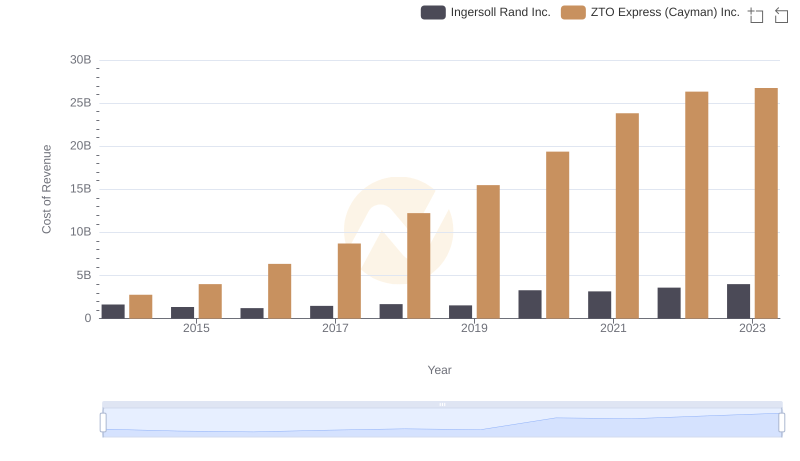
Ingersoll Rand Inc. vs ZTO Express (Cayman) Inc.: Efficiency in Cost of Revenue Explored
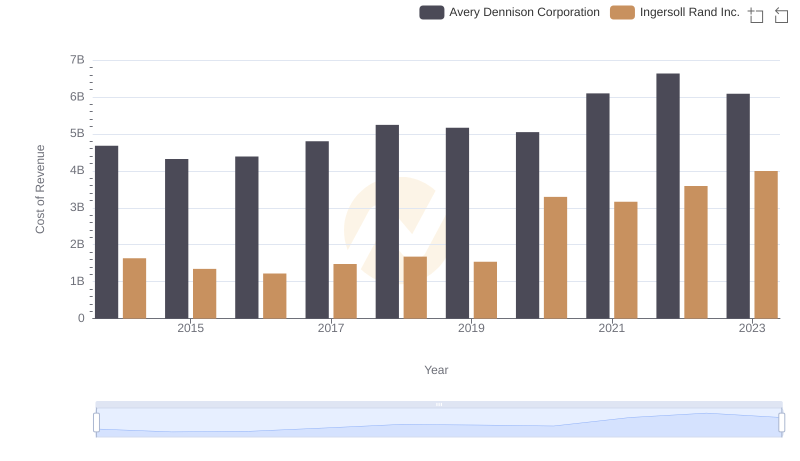
Analyzing Cost of Revenue: Ingersoll Rand Inc. and Avery Dennison Corporation
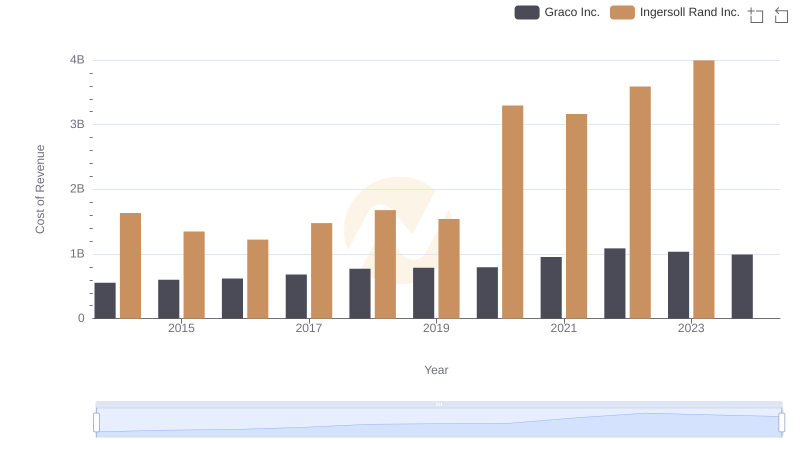
Cost of Revenue Comparison: Ingersoll Rand Inc. vs Graco Inc.
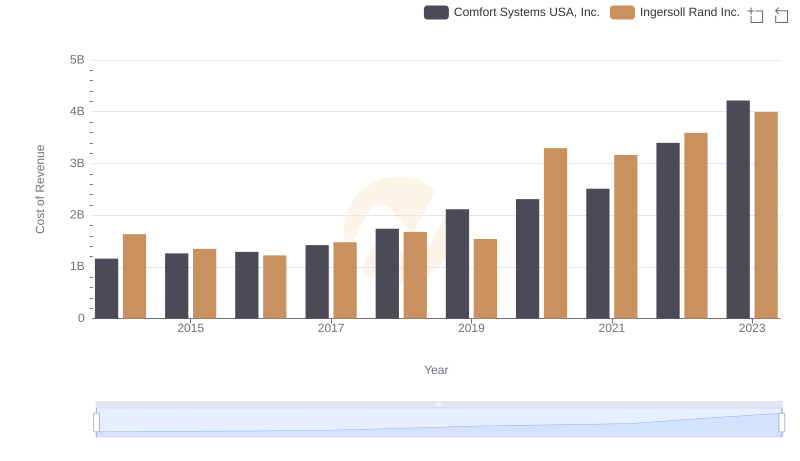
Analyzing Cost of Revenue: Ingersoll Rand Inc. and Comfort Systems USA, Inc.
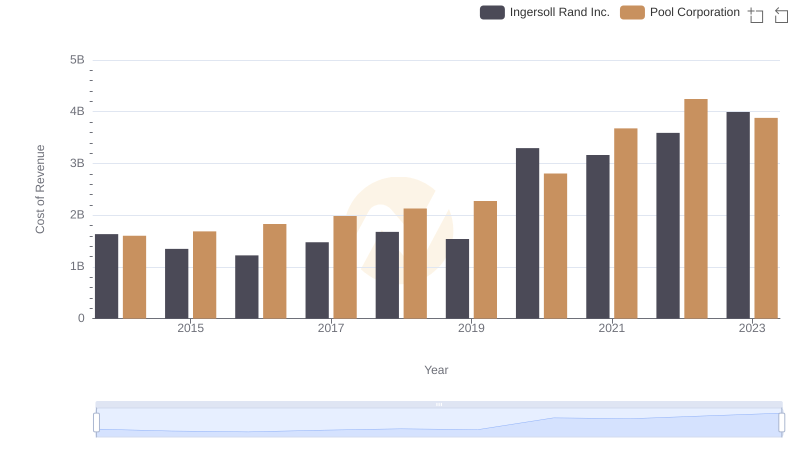
Cost Insights: Breaking Down Ingersoll Rand Inc. and Pool Corporation's Expenses
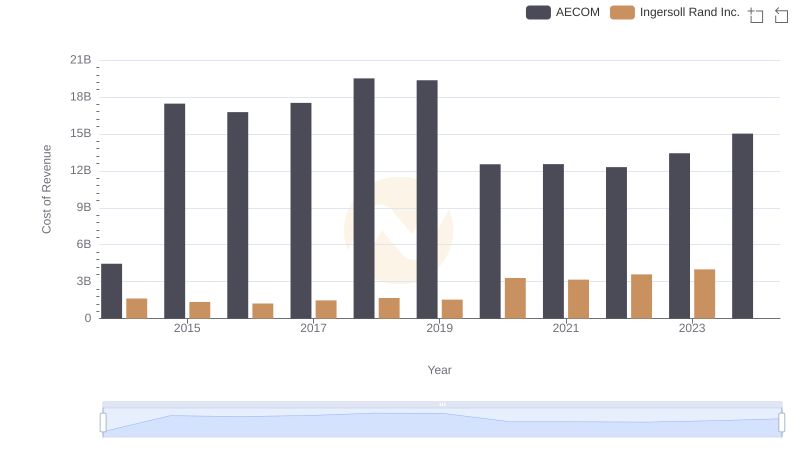
Cost Insights: Breaking Down Ingersoll Rand Inc. and AECOM's Expenses
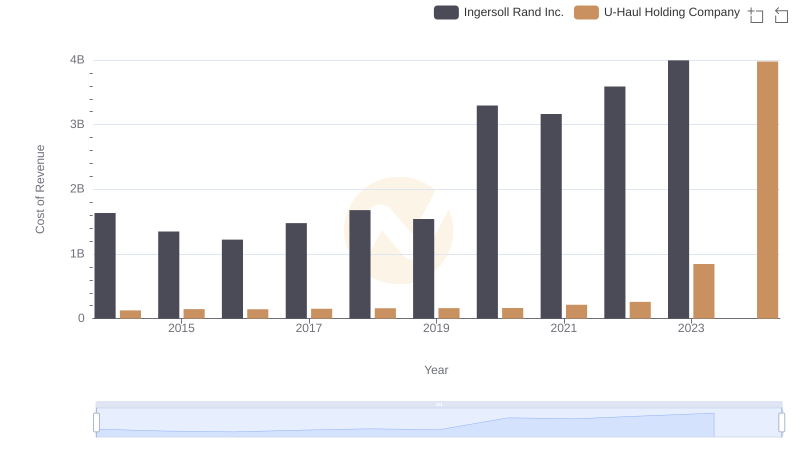
Ingersoll Rand Inc. vs U-Haul Holding Company: Efficiency in Cost of Revenue Explored