| __timestamp | Infosys Limited | Synopsys, Inc. |
|---|---|---|
| Wednesday, January 1, 2014 | 2258000000 | 441543000 |
| Thursday, January 1, 2015 | 2590000000 | 496245000 |
| Friday, January 1, 2016 | 2765000000 | 540351000 |
| Sunday, January 1, 2017 | 2936000000 | 584909000 |
| Monday, January 1, 2018 | 2984000000 | 581213000 |
| Tuesday, January 1, 2019 | 3053000000 | 761347000 |
| Wednesday, January 1, 2020 | 4053342784 | 857403000 |
| Friday, January 1, 2021 | 4116000000 | 1101071000 |
| Saturday, January 1, 2022 | 4707334610 | 1435158000 |
| Sunday, January 1, 2023 | 4206000000 | 1647785000 |
| Monday, January 1, 2024 | 1355711000 |
In pursuit of knowledge
In the ever-evolving landscape of global technology, the financial performance of industry giants like Infosys Limited and Synopsys, Inc. offers valuable insights into market dynamics. Over the past decade, Infosys has demonstrated a robust EBITDA growth, peaking in 2022 with a remarkable 108% increase from its 2014 figures. This growth trajectory underscores Infosys's strategic prowess in navigating the competitive IT services sector.
Conversely, Synopsys, Inc., a leader in electronic design automation, has shown a steady upward trend, with its EBITDA more than tripling from 2014 to 2023. This consistent growth highlights Synopsys's resilience and adaptability in the semiconductor industry.
While Infosys experienced a slight dip in 2023, Synopsys continued its upward momentum, reflecting differing market challenges and opportunities. Notably, data for Infosys in 2024 is unavailable, leaving room for speculation on its future performance.
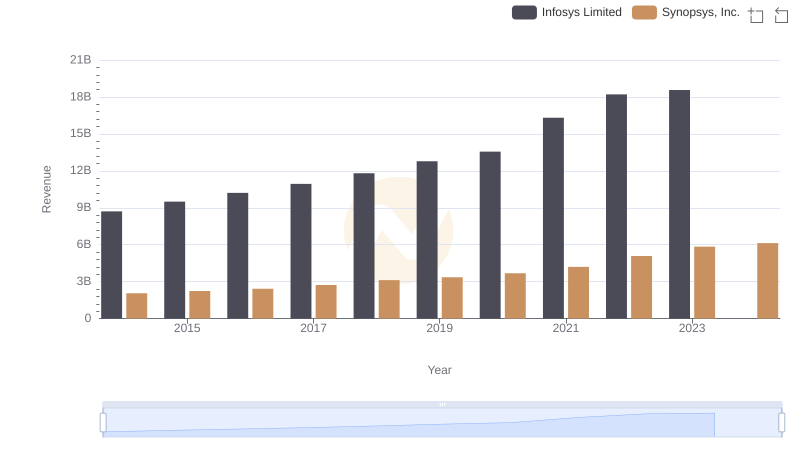
Revenue Insights: Infosys Limited and Synopsys, Inc. Performance Compared
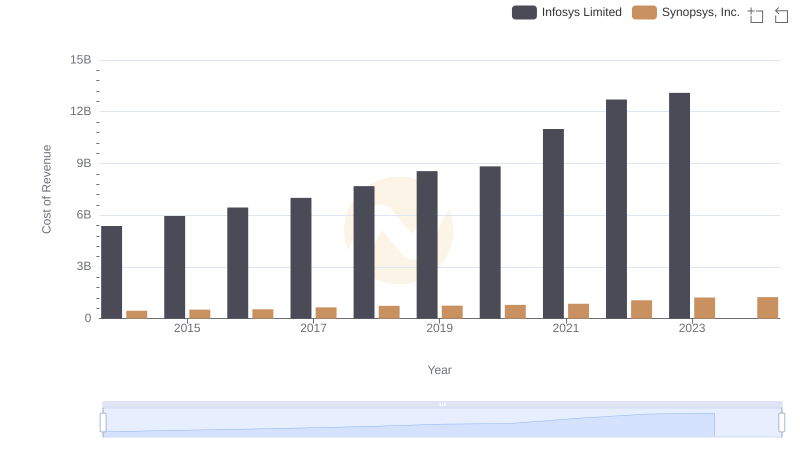
Cost of Revenue: Key Insights for Infosys Limited and Synopsys, Inc.
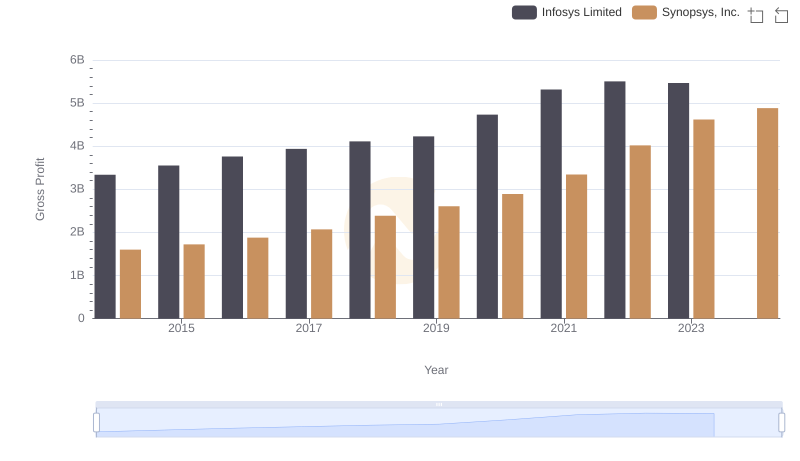
Gross Profit Analysis: Comparing Infosys Limited and Synopsys, Inc.
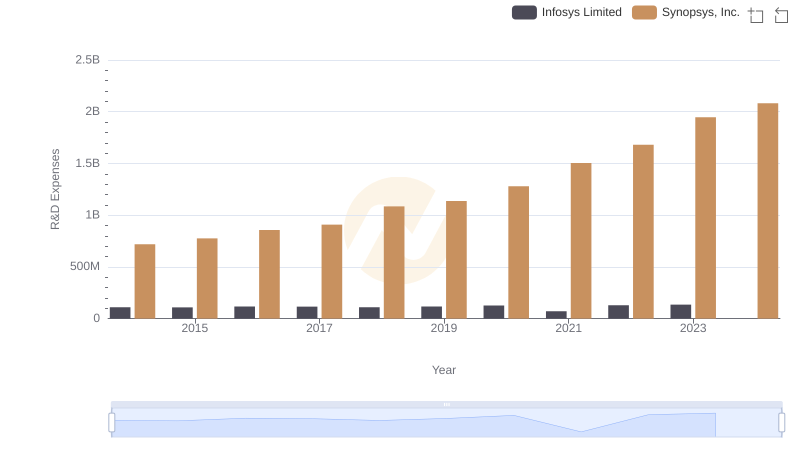
Research and Development Investment: Infosys Limited vs Synopsys, Inc.
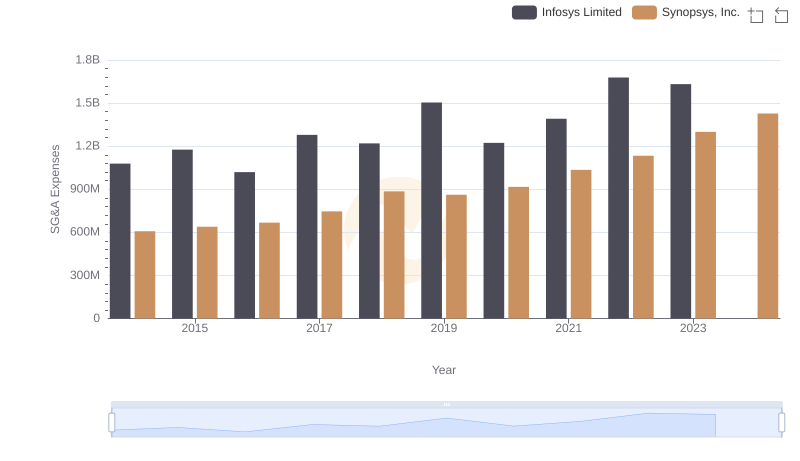
Selling, General, and Administrative Costs: Infosys Limited vs Synopsys, Inc.
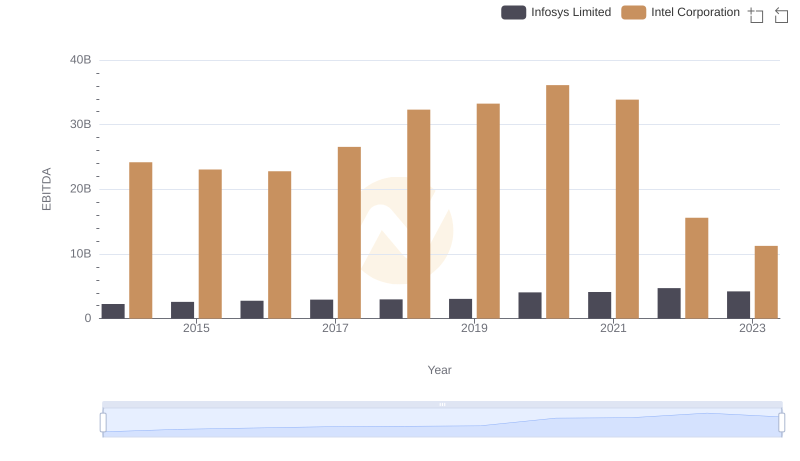
EBITDA Performance Review: Infosys Limited vs Intel Corporation
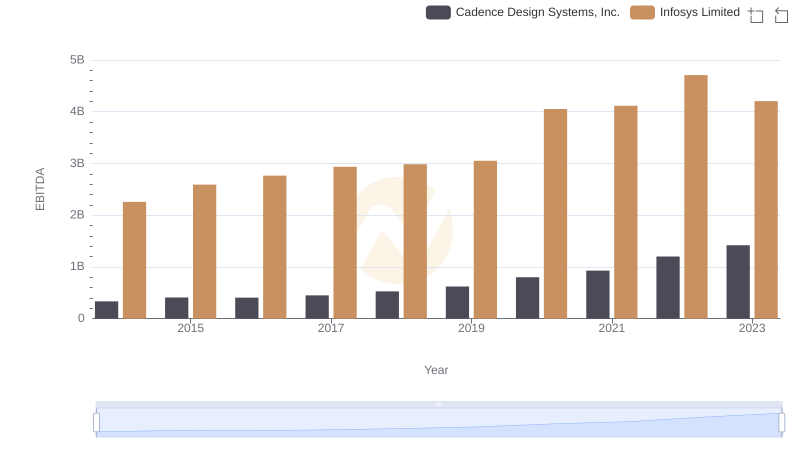
Comparative EBITDA Analysis: Infosys Limited vs Cadence Design Systems, Inc.
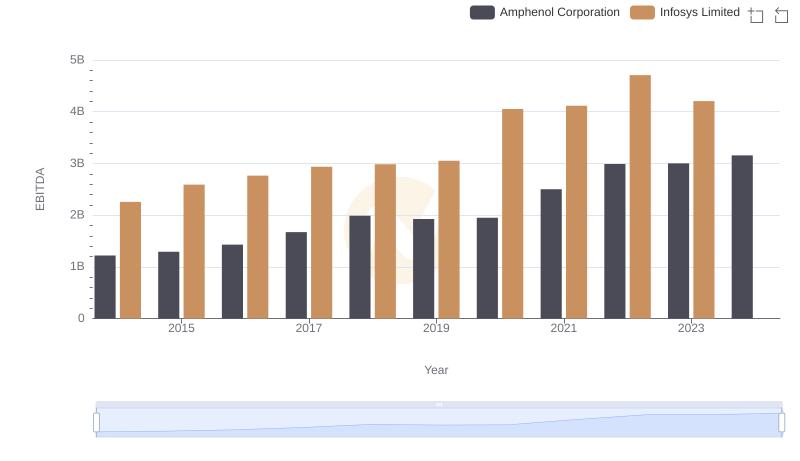
A Side-by-Side Analysis of EBITDA: Infosys Limited and Amphenol Corporation
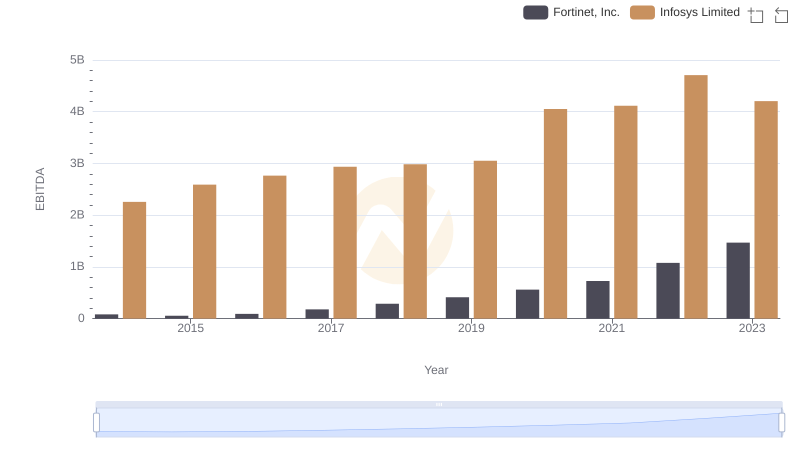
EBITDA Metrics Evaluated: Infosys Limited vs Fortinet, Inc.
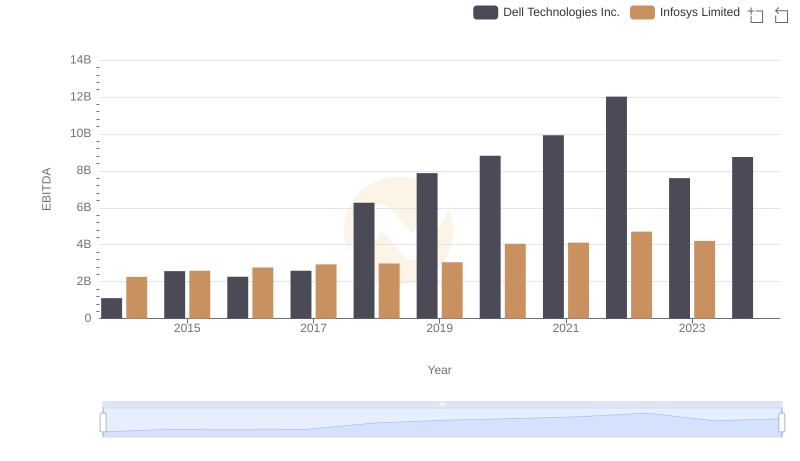
EBITDA Metrics Evaluated: Infosys Limited vs Dell Technologies Inc.
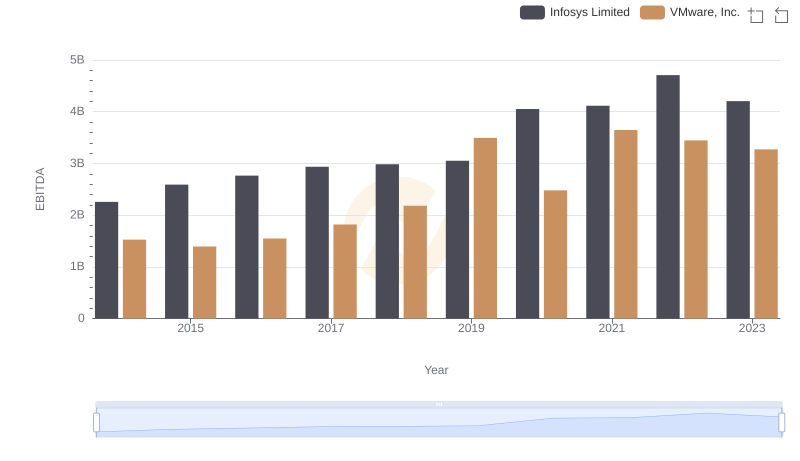
Comprehensive EBITDA Comparison: Infosys Limited vs VMware, Inc.
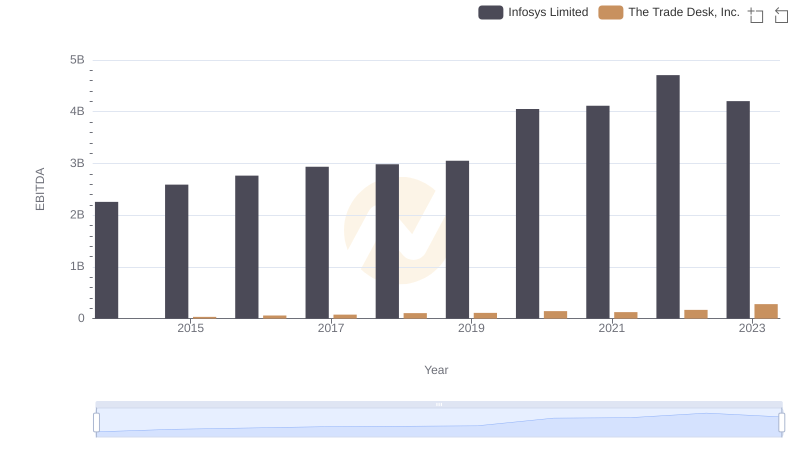
Infosys Limited and The Trade Desk, Inc.: A Detailed Examination of EBITDA Performance