| __timestamp | Infosys Limited | Synopsys, Inc. |
|---|---|---|
| Wednesday, January 1, 2014 | 1079000000 | 608294000 |
| Thursday, January 1, 2015 | 1176000000 | 639504000 |
| Friday, January 1, 2016 | 1020000000 | 668330000 |
| Sunday, January 1, 2017 | 1279000000 | 746092000 |
| Monday, January 1, 2018 | 1220000000 | 885538000 |
| Tuesday, January 1, 2019 | 1504000000 | 862108000 |
| Wednesday, January 1, 2020 | 1223000000 | 916540000 |
| Friday, January 1, 2021 | 1391000000 | 1035479000 |
| Saturday, January 1, 2022 | 1678000000 | 1133617000 |
| Sunday, January 1, 2023 | 1632000000 | 1299327000 |
| Monday, January 1, 2024 | 1427838000 |
Data in motion
In the ever-evolving landscape of global business, understanding the financial strategies of industry leaders is crucial. This analysis delves into the Selling, General, and Administrative (SG&A) expenses of two tech giants: Infosys Limited and Synopsys, Inc., from 2014 to 2023.
Over the past decade, Infosys Limited has consistently allocated a significant portion of its revenue to SG&A expenses, peaking in 2022 with a 64% increase from 2014. In contrast, Synopsys, Inc. has shown a steady upward trend, with a remarkable 135% rise in SG&A expenses over the same period. This growth reflects Synopsys' aggressive expansion and investment in administrative capabilities.
While Infosys' data for 2024 is unavailable, Synopsys continues its upward trajectory, indicating a robust financial strategy. This comparison highlights the diverse approaches these companies take in managing operational costs, offering valuable insights for investors and industry analysts.
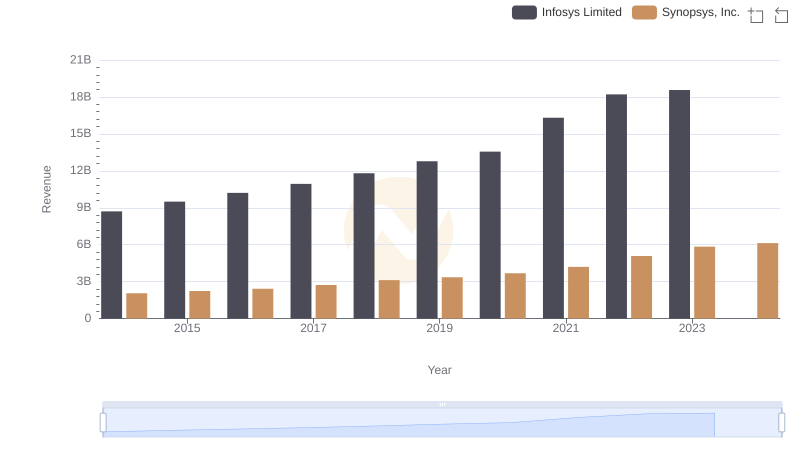
Revenue Insights: Infosys Limited and Synopsys, Inc. Performance Compared
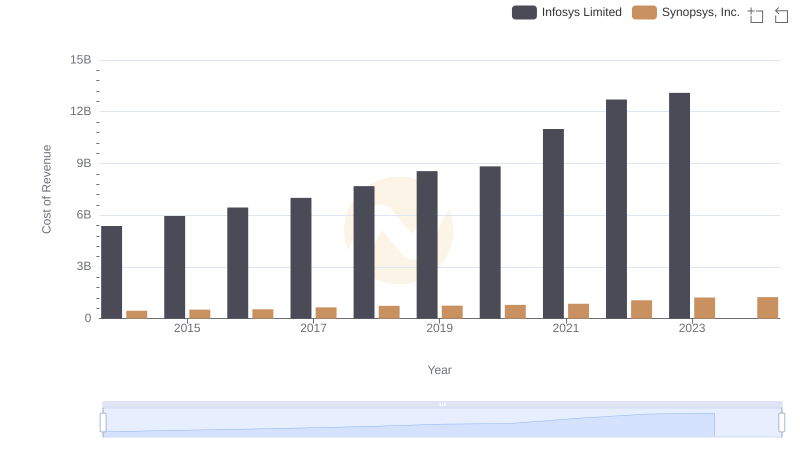
Cost of Revenue: Key Insights for Infosys Limited and Synopsys, Inc.
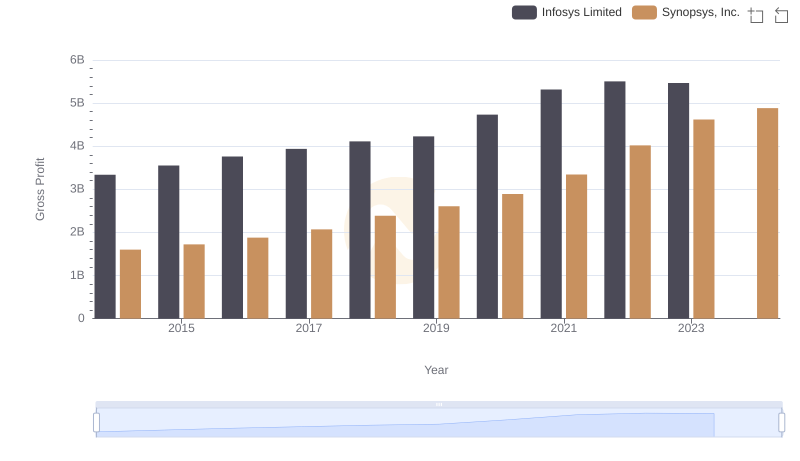
Gross Profit Analysis: Comparing Infosys Limited and Synopsys, Inc.
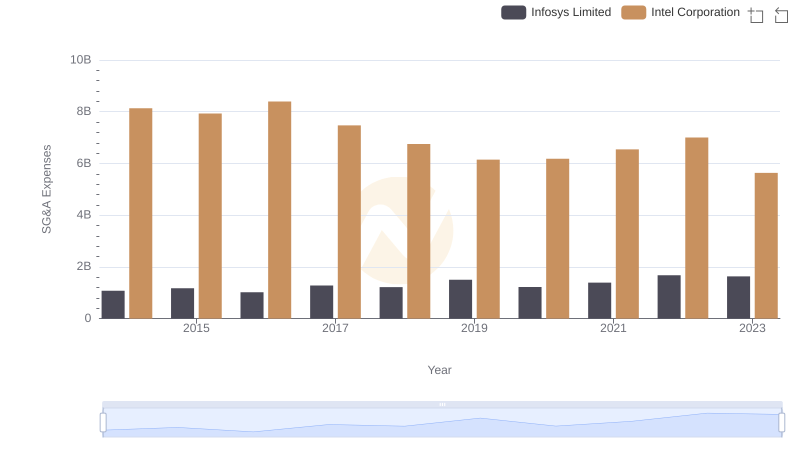
Infosys Limited and Intel Corporation: SG&A Spending Patterns Compared
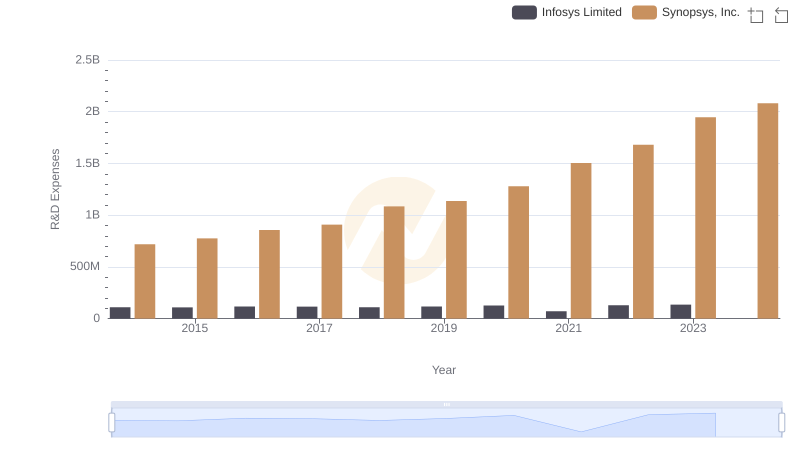
Research and Development Investment: Infosys Limited vs Synopsys, Inc.
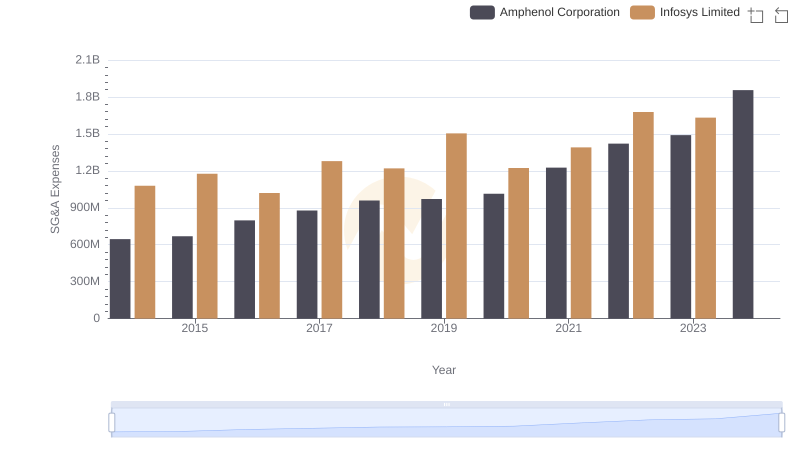
Who Optimizes SG&A Costs Better? Infosys Limited or Amphenol Corporation
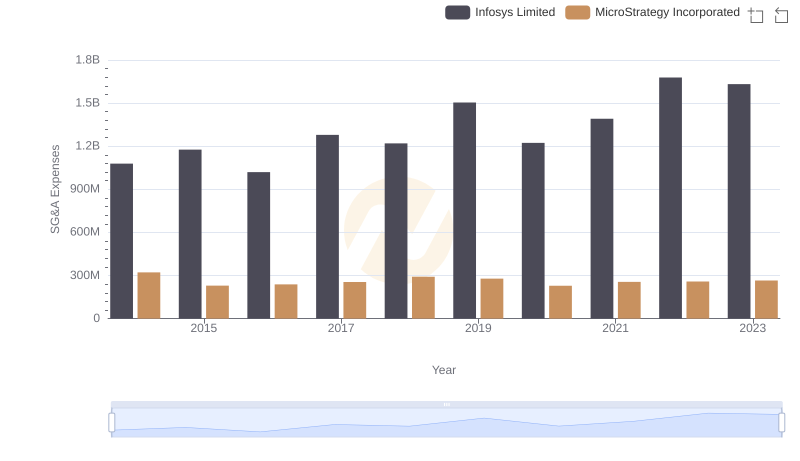
Breaking Down SG&A Expenses: Infosys Limited vs MicroStrategy Incorporated
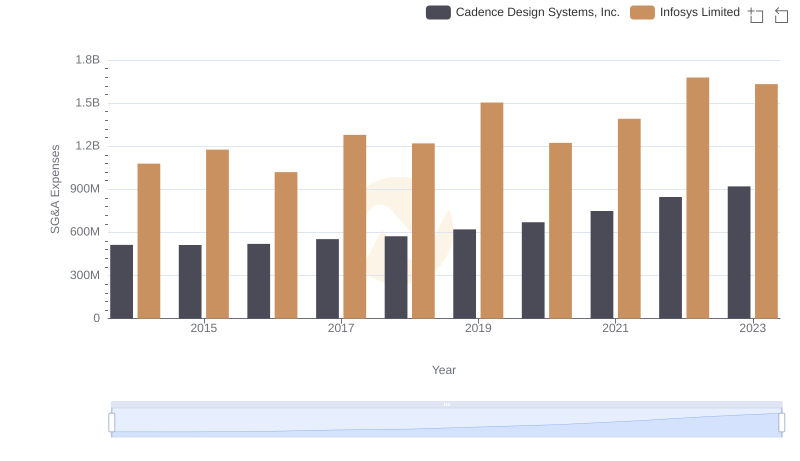
Infosys Limited or Cadence Design Systems, Inc.: Who Manages SG&A Costs Better?
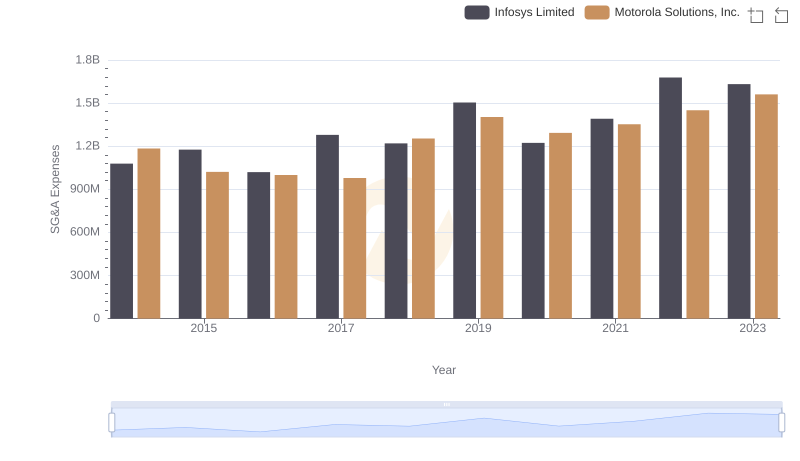
Comparing SG&A Expenses: Infosys Limited vs Motorola Solutions, Inc. Trends and Insights
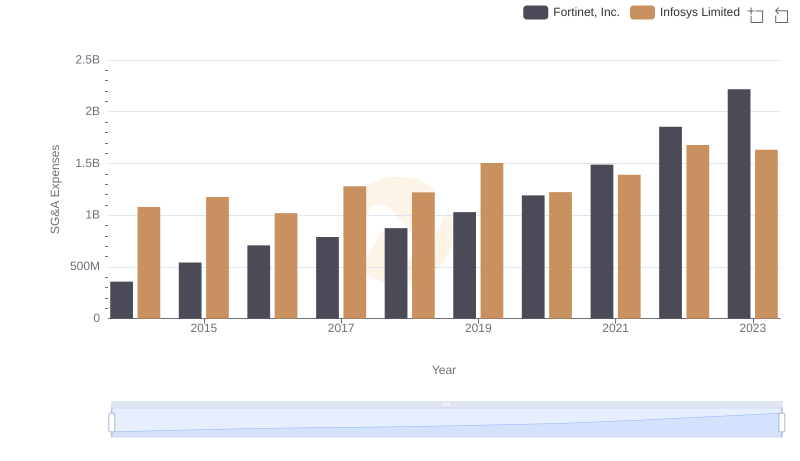
Comparing SG&A Expenses: Infosys Limited vs Fortinet, Inc. Trends and Insights
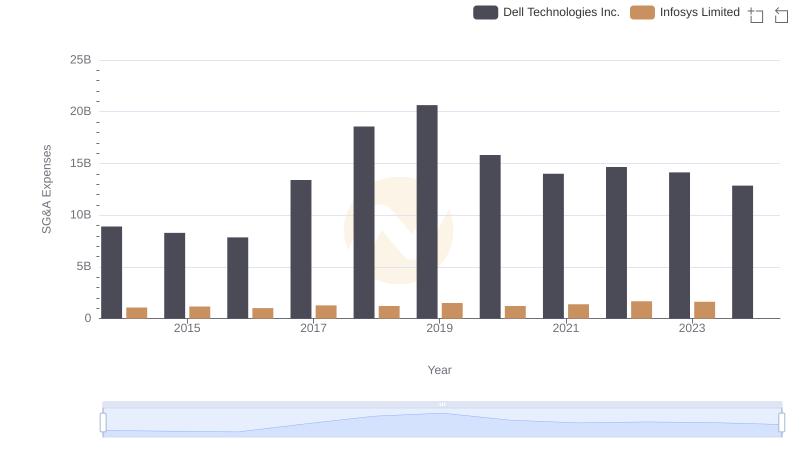
Infosys Limited or Dell Technologies Inc.: Who Manages SG&A Costs Better?
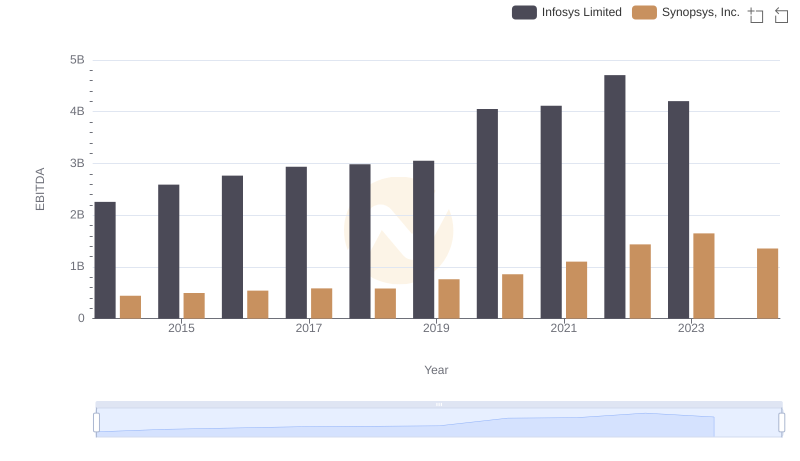
EBITDA Performance Review: Infosys Limited vs Synopsys, Inc.