| __timestamp | Eaton Corporation plc | Snap-on Incorporated |
|---|---|---|
| Wednesday, January 1, 2014 | 22552000000 | 3277700000 |
| Thursday, January 1, 2015 | 20855000000 | 3352800000 |
| Friday, January 1, 2016 | 19747000000 | 3430400000 |
| Sunday, January 1, 2017 | 20404000000 | 3686900000 |
| Monday, January 1, 2018 | 21609000000 | 3740700000 |
| Tuesday, January 1, 2019 | 21390000000 | 3730000000 |
| Wednesday, January 1, 2020 | 17858000000 | 3592500000 |
| Friday, January 1, 2021 | 19628000000 | 4252000000 |
| Saturday, January 1, 2022 | 20752000000 | 4492800000 |
| Sunday, January 1, 2023 | 23196000000 | 5108300000 |
| Monday, January 1, 2024 | 24878000000 | 4707400000 |
Unleashing the power of data
In the ever-evolving landscape of industrial manufacturing, Eaton Corporation plc and Snap-on Incorporated have showcased intriguing revenue trajectories over the past decade. From 2014 to 2023, Eaton's revenue demonstrated a resilient growth pattern, peaking in 2023 with a 15% increase from its 2014 figures. This growth underscores Eaton's strategic adaptability and market penetration.
Conversely, Snap-on Incorporated, a leader in professional tools, experienced a robust revenue surge, culminating in a 56% rise by 2023 compared to 2014. This remarkable growth highlights Snap-on's successful expansion and innovation in its product offerings.
The data reveals a compelling narrative of two industrial giants navigating market challenges and opportunities. As Eaton and Snap-on continue to innovate, their revenue trends offer valuable insights into the broader industrial sector's dynamics.
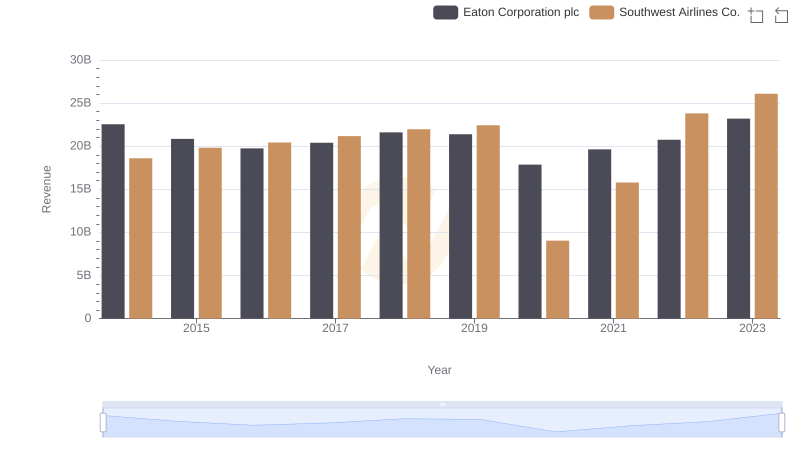
Revenue Insights: Eaton Corporation plc and Southwest Airlines Co. Performance Compared
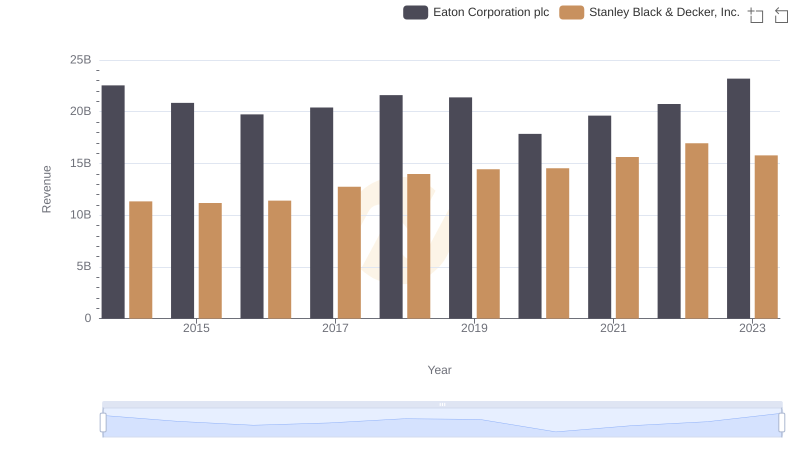
Annual Revenue Comparison: Eaton Corporation plc vs Stanley Black & Decker, Inc.
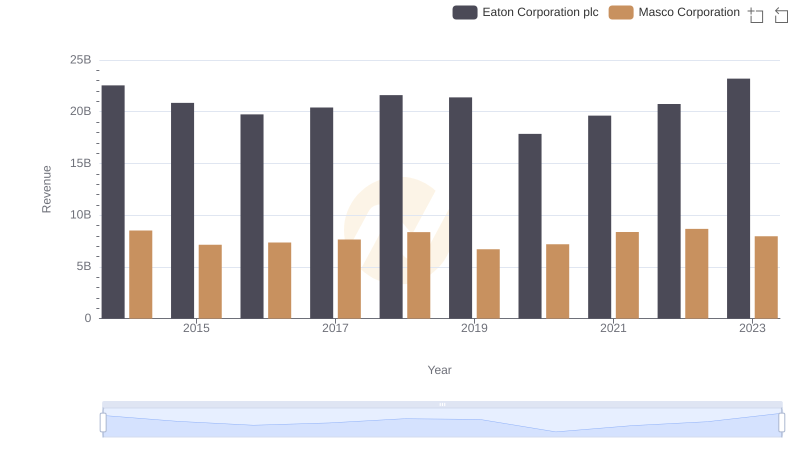
Eaton Corporation plc vs Masco Corporation: Examining Key Revenue Metrics
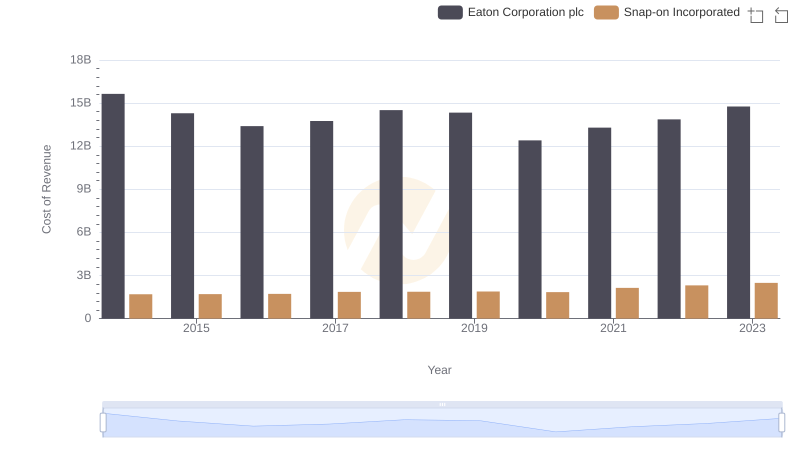
Cost of Revenue: Key Insights for Eaton Corporation plc and Snap-on Incorporated
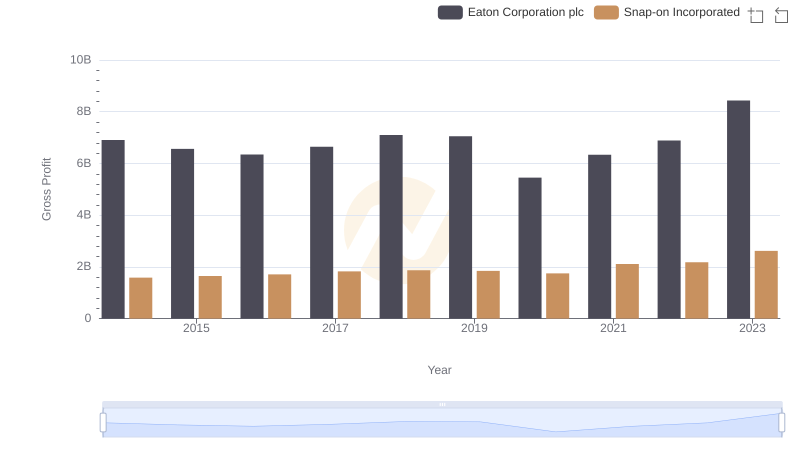
Eaton Corporation plc vs Snap-on Incorporated: A Gross Profit Performance Breakdown
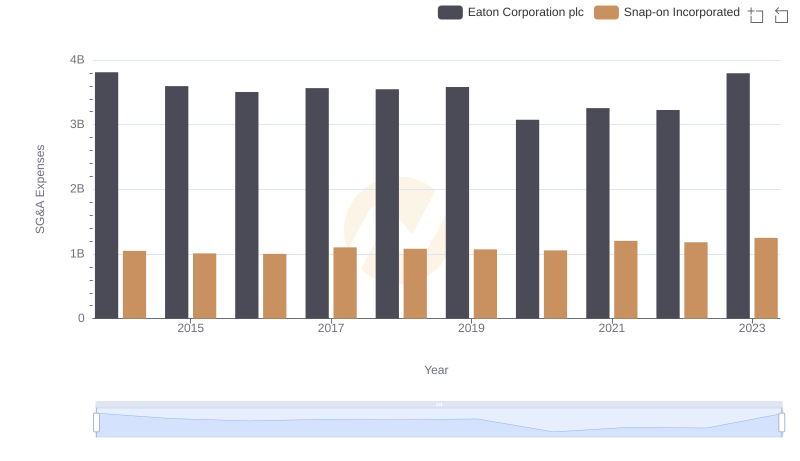
SG&A Efficiency Analysis: Comparing Eaton Corporation plc and Snap-on Incorporated