| __timestamp | Cisco Systems, Inc. | MicroStrategy Incorporated |
|---|---|---|
| Wednesday, January 1, 2014 | 27769000000 | 444620000 |
| Thursday, January 1, 2015 | 29681000000 | 428761000 |
| Friday, January 1, 2016 | 30960000000 | 419014000 |
| Sunday, January 1, 2017 | 30224000000 | 407894000 |
| Monday, January 1, 2018 | 30606000000 | 398139000 |
| Tuesday, January 1, 2019 | 32666000000 | 386353000 |
| Wednesday, January 1, 2020 | 31683000000 | 389680000 |
| Friday, January 1, 2021 | 31894000000 | 418853000 |
| Saturday, January 1, 2022 | 32248000000 | 396275000 |
| Sunday, January 1, 2023 | 35753000000 | 386317000 |
| Monday, January 1, 2024 | 34828000000 | 333988000 |
Unlocking the unknown
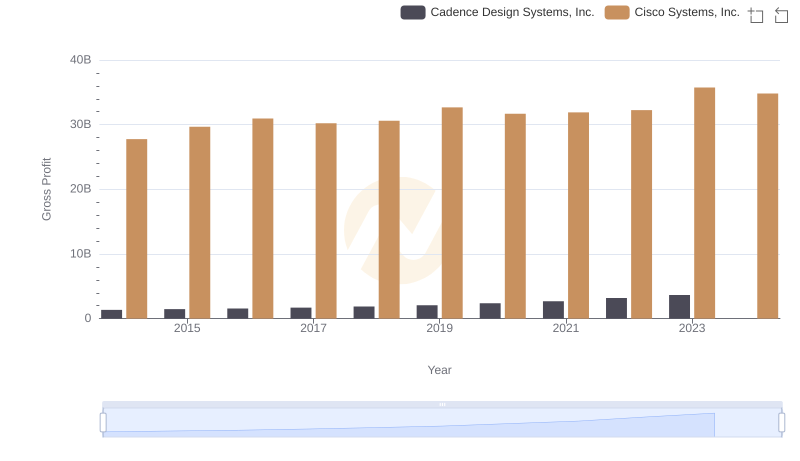
In the ever-evolving landscape of technology, Cisco Systems, Inc. and MicroStrategy Incorporated have carved distinct niches. From 2014 to 2023, Cisco's gross profit consistently outpaced MicroStrategy's, highlighting its robust market position. Cisco's gross profit surged by approximately 29% over this period, peaking in 2023 with a remarkable 35.8 billion USD. In contrast, MicroStrategy's performance remained relatively stable, with a slight decline in 2023 to 386 million USD.
This disparity underscores Cisco's dominance in the tech industry, driven by its expansive product portfolio and strategic acquisitions. Meanwhile, MicroStrategy's focus on business intelligence and analytics has kept its growth steady, albeit modest. The absence of data for MicroStrategy in 2024 suggests potential challenges or strategic shifts. As the tech world continues to innovate, these companies' financial trajectories offer valuable insights into their strategic priorities and market dynamics.
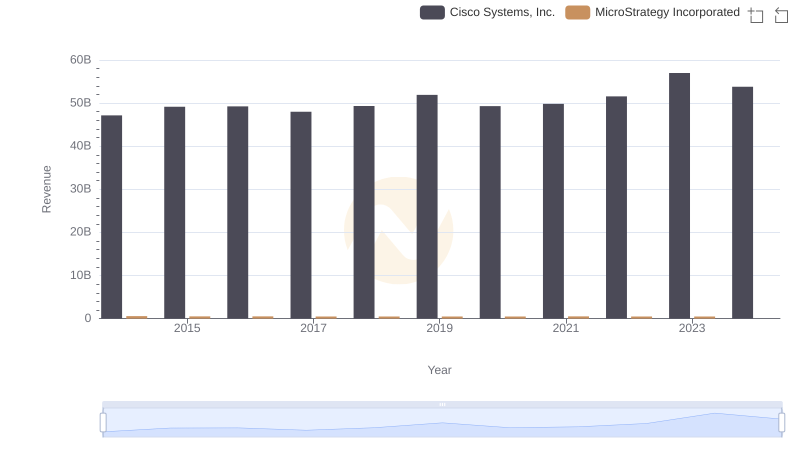
Cisco Systems, Inc. and MicroStrategy Incorporated: A Comprehensive Revenue Analysis
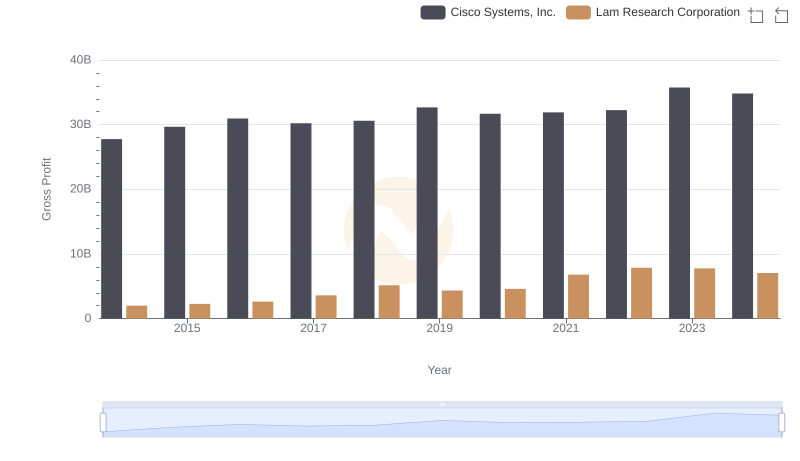
Who Generates Higher Gross Profit? Cisco Systems, Inc. or Lam Research Corporation
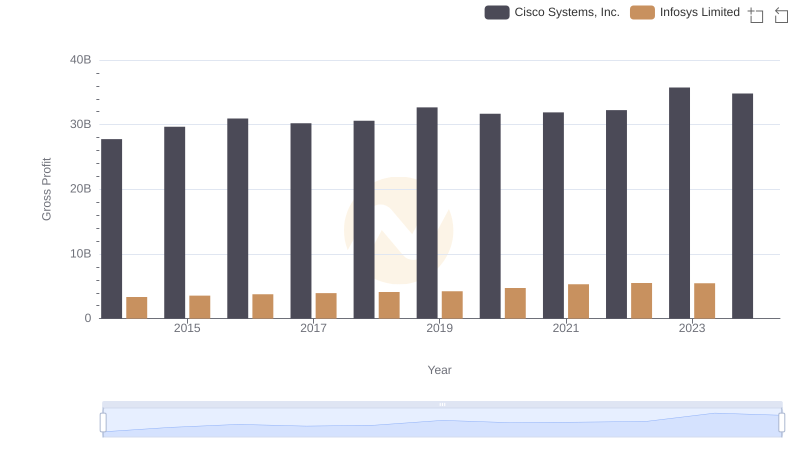
Gross Profit Analysis: Comparing Cisco Systems, Inc. and Infosys Limited
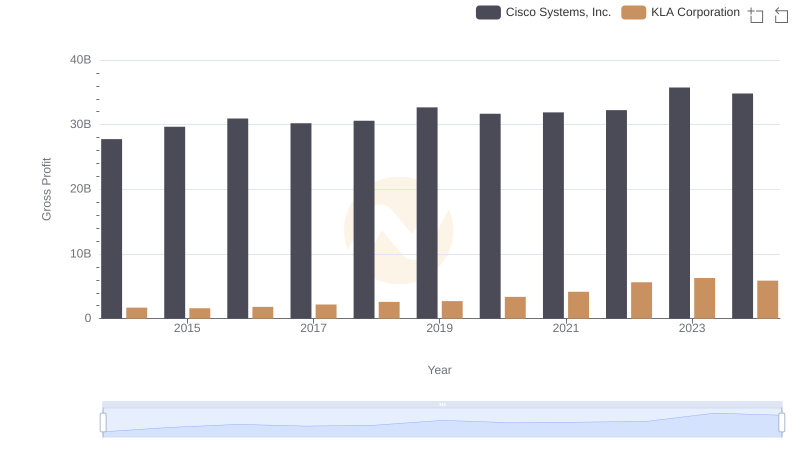
Gross Profit Comparison: Cisco Systems, Inc. and KLA Corporation Trends
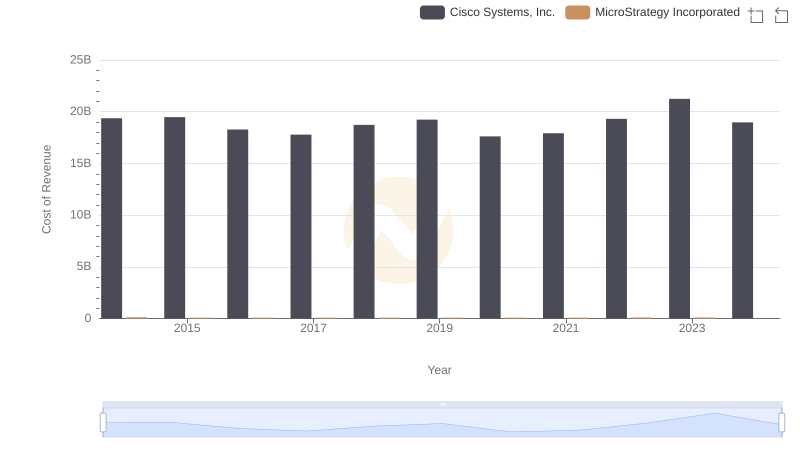
Cost of Revenue: Key Insights for Cisco Systems, Inc. and MicroStrategy Incorporated
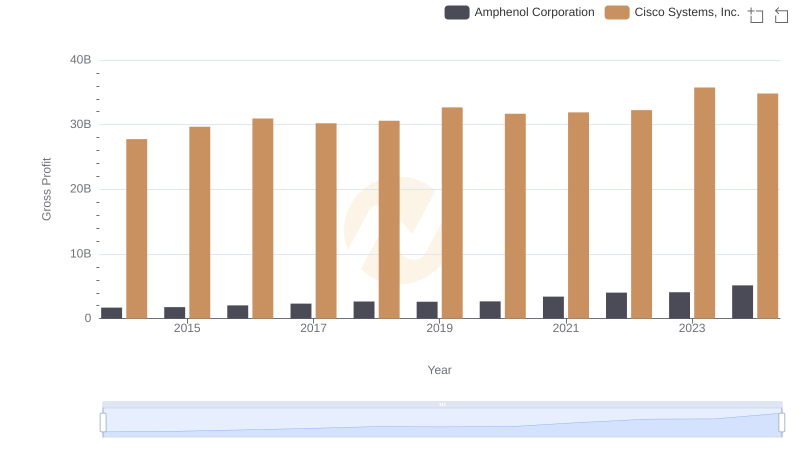
Key Insights on Gross Profit: Cisco Systems, Inc. vs Amphenol Corporation
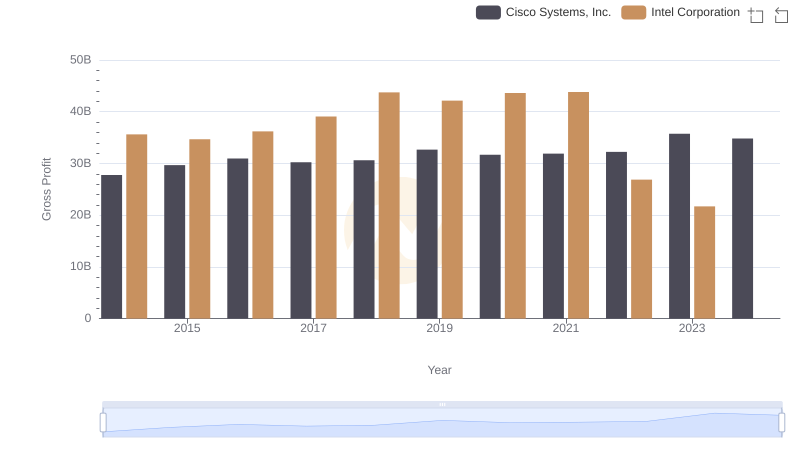
Cisco Systems, Inc. vs Intel Corporation: A Gross Profit Performance Breakdown
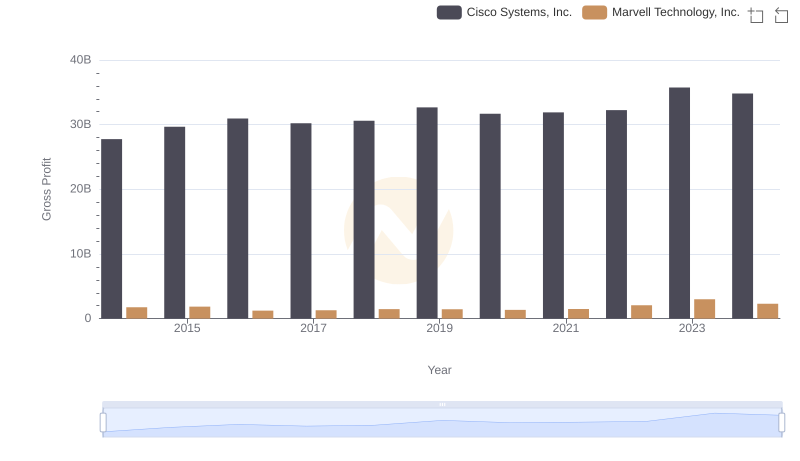
Cisco Systems, Inc. vs Marvell Technology, Inc.: A Gross Profit Performance Breakdown
Gross Profit Analysis: Comparing Cisco Systems, Inc. and Cadence Design Systems, Inc.
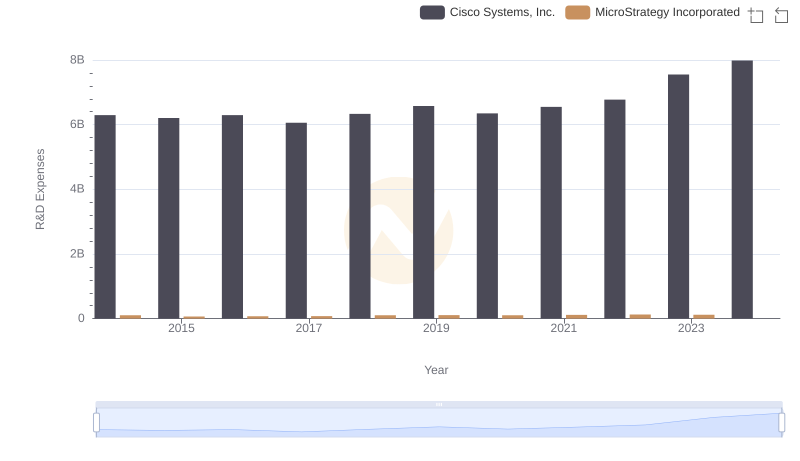
R&D Spending Showdown: Cisco Systems, Inc. vs MicroStrategy Incorporated
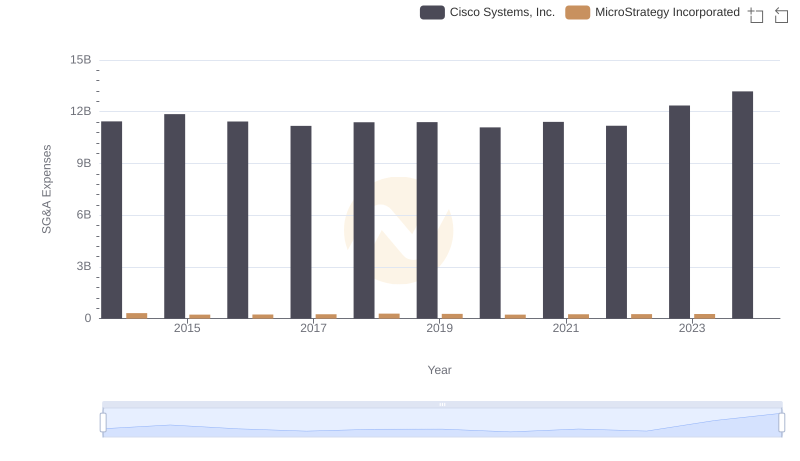
Comparing SG&A Expenses: Cisco Systems, Inc. vs MicroStrategy Incorporated Trends and Insights