| __timestamp | Cisco Systems, Inc. | Infosys Limited |
|---|---|---|
| Wednesday, January 1, 2014 | 27769000000 | 3337000000 |
| Thursday, January 1, 2015 | 29681000000 | 3551000000 |
| Friday, January 1, 2016 | 30960000000 | 3762000000 |
| Sunday, January 1, 2017 | 30224000000 | 3938000000 |
| Monday, January 1, 2018 | 30606000000 | 4112000000 |
| Tuesday, January 1, 2019 | 32666000000 | 4228000000 |
| Wednesday, January 1, 2020 | 31683000000 | 4733000000 |
| Friday, January 1, 2021 | 31894000000 | 5315000000 |
| Saturday, January 1, 2022 | 32248000000 | 5503000000 |
| Sunday, January 1, 2023 | 35753000000 | 5466000000 |
| Monday, January 1, 2024 | 34828000000 |
Igniting the spark of knowledge
In the ever-evolving tech industry, understanding financial health is crucial. This analysis compares the gross profit trends of two giants: Cisco Systems, Inc. and Infosys Limited, from 2014 to 2023. Cisco, a leader in networking hardware, consistently outperformed Infosys, an IT services powerhouse, with gross profits averaging over seven times higher. Notably, Cisco's gross profit surged by approximately 29% from 2014 to 2023, peaking in 2023. Meanwhile, Infosys showed a steady growth of around 64% over the same period, reflecting its expanding global footprint. However, data for 2024 is incomplete, highlighting the need for ongoing analysis. This comparison underscores the diverse strategies and market positions of these tech titans, offering valuable insights for investors and industry watchers alike.
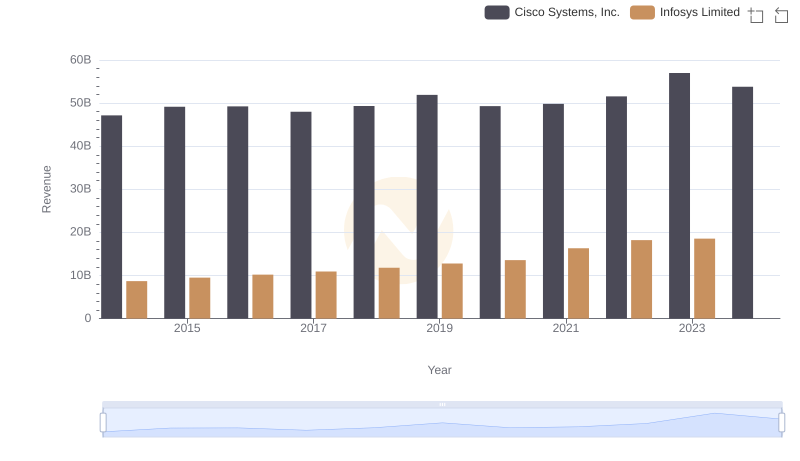
Cisco Systems, Inc. vs Infosys Limited: Annual Revenue Growth Compared
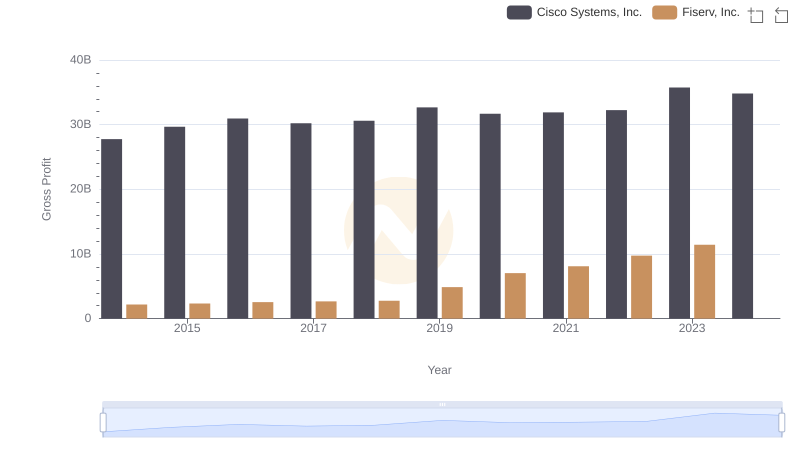
Key Insights on Gross Profit: Cisco Systems, Inc. vs Fiserv, Inc.
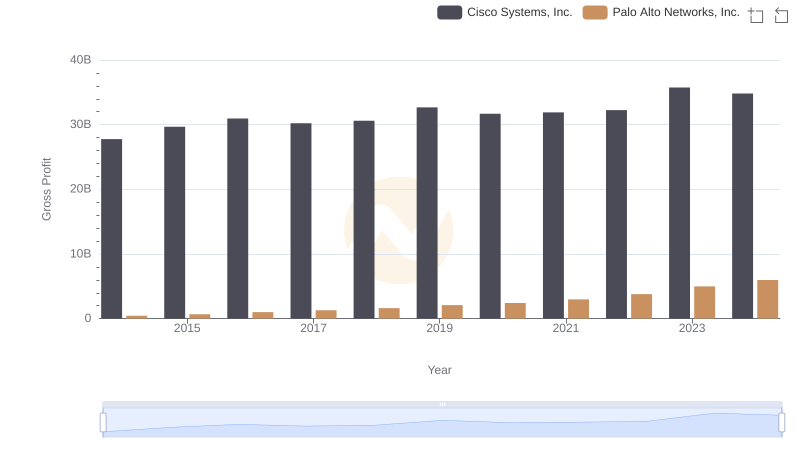
Who Generates Higher Gross Profit? Cisco Systems, Inc. or Palo Alto Networks, Inc.
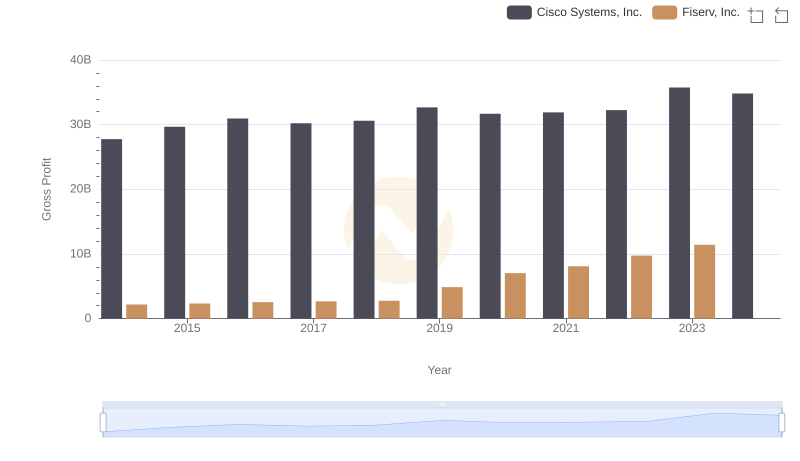
Key Insights on Gross Profit: Cisco Systems, Inc. vs Fiserv, Inc.
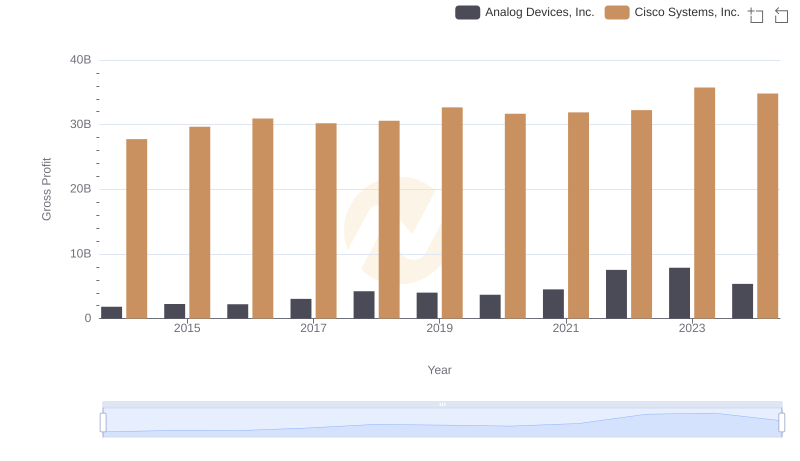
Gross Profit Analysis: Comparing Cisco Systems, Inc. and Analog Devices, Inc.
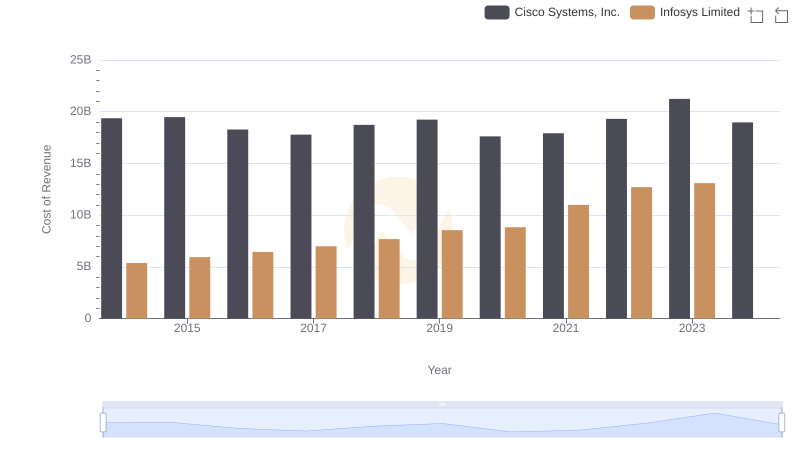
Cost of Revenue: Key Insights for Cisco Systems, Inc. and Infosys Limited
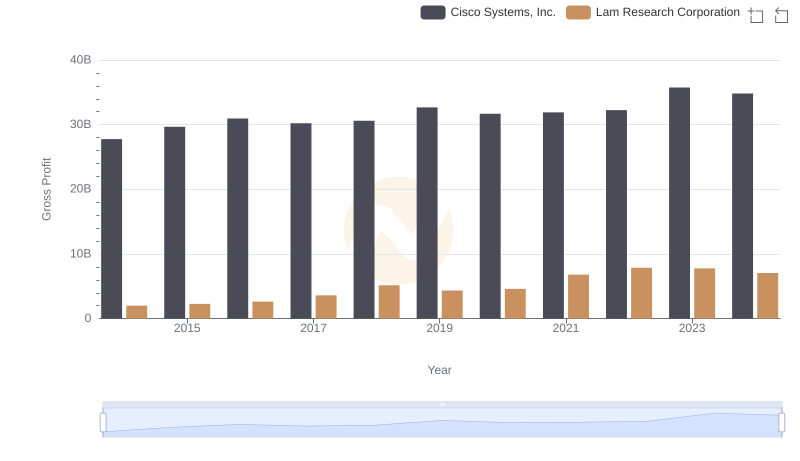
Who Generates Higher Gross Profit? Cisco Systems, Inc. or Lam Research Corporation
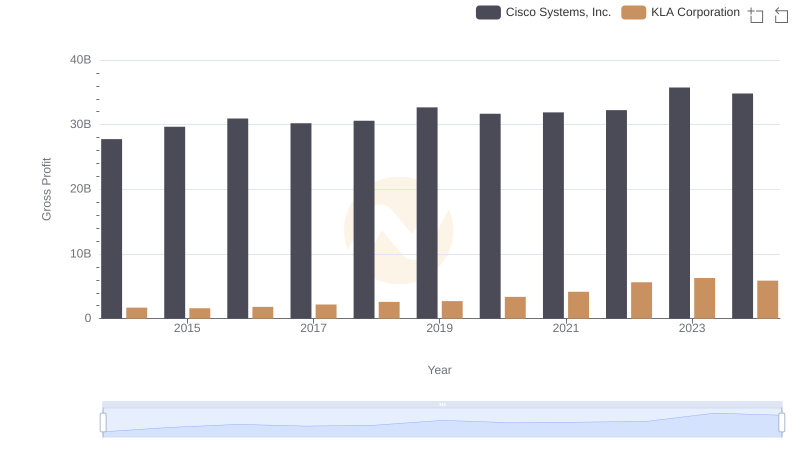
Gross Profit Comparison: Cisco Systems, Inc. and KLA Corporation Trends
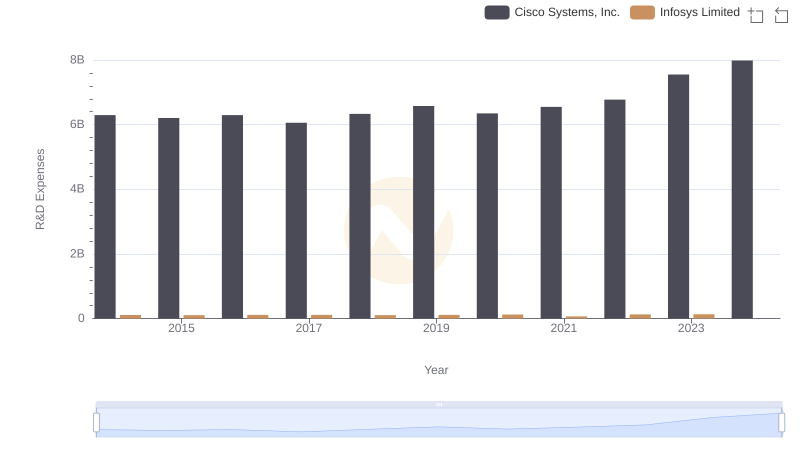
Analyzing R&D Budgets: Cisco Systems, Inc. vs Infosys Limited
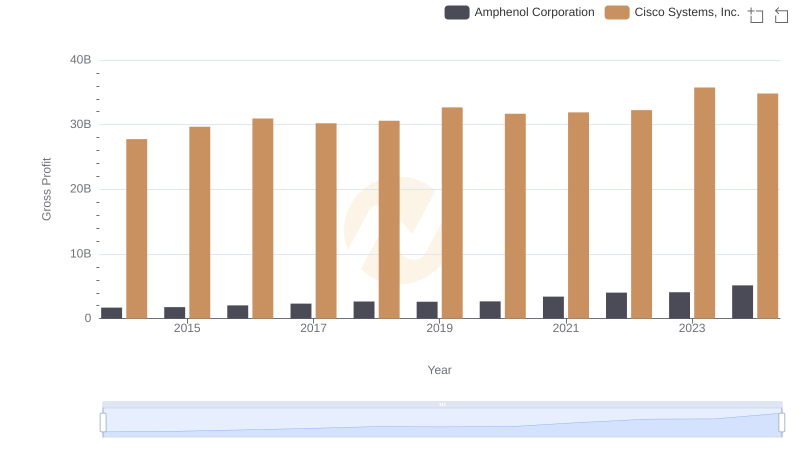
Key Insights on Gross Profit: Cisco Systems, Inc. vs Amphenol Corporation
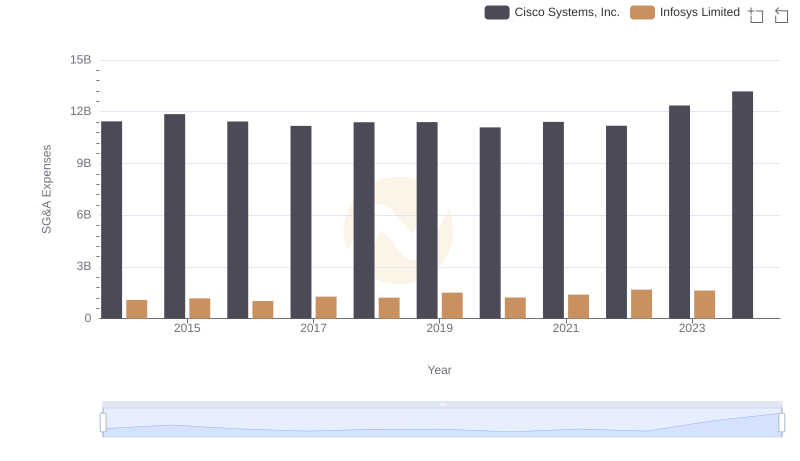
Cisco Systems, Inc. and Infosys Limited: SG&A Spending Patterns Compared
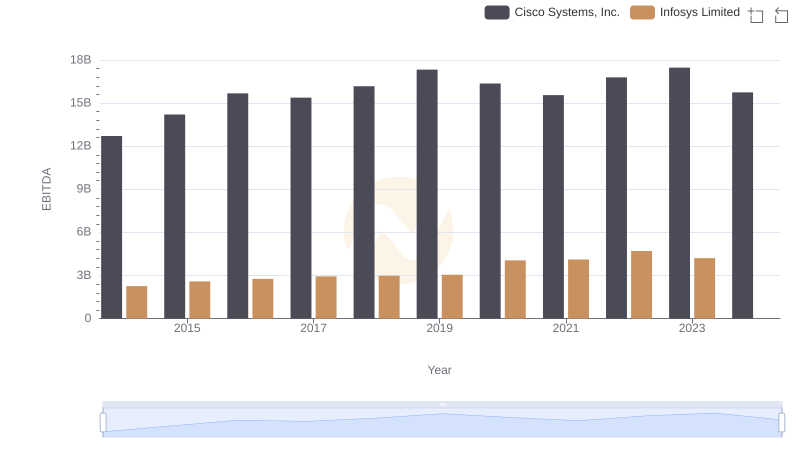
Professional EBITDA Benchmarking: Cisco Systems, Inc. vs Infosys Limited