| __timestamp | Cisco Systems, Inc. | Workday, Inc. |
|---|---|---|
| Wednesday, January 1, 2014 | 19373000000 | 176810000 |
| Thursday, January 1, 2015 | 19480000000 | 264803000 |
| Friday, January 1, 2016 | 18287000000 | 374427000 |
| Sunday, January 1, 2017 | 17781000000 | 483545000 |
| Monday, January 1, 2018 | 18724000000 | 629413000 |
| Tuesday, January 1, 2019 | 19238000000 | 834950000 |
| Wednesday, January 1, 2020 | 17618000000 | 1065258000 |
| Friday, January 1, 2021 | 17924000000 | 1198132000 |
| Saturday, January 1, 2022 | 19309000000 | 1428095000 |
| Sunday, January 1, 2023 | 21245000000 | 1715178000 |
| Monday, January 1, 2024 | 18975000000 | 1771000000 |
Unveiling the hidden dimensions of data
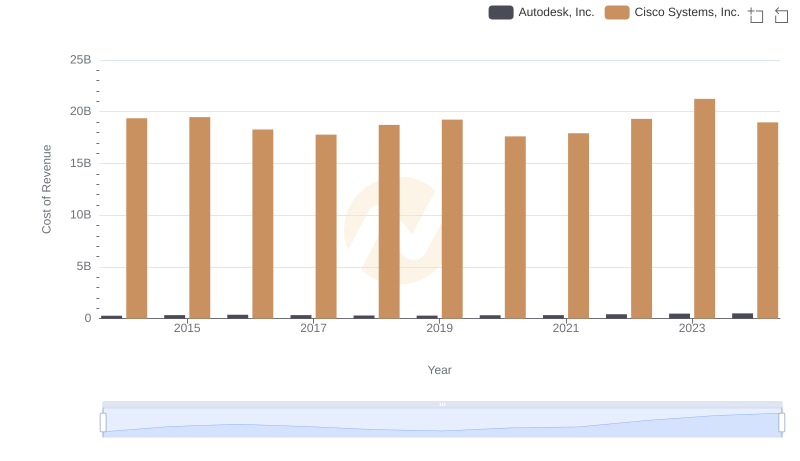
In the ever-evolving tech industry, understanding cost structures is crucial for investors and analysts. Cisco Systems, Inc., a stalwart in networking technology, and Workday, Inc., a leader in enterprise cloud applications, present intriguing contrasts in their cost of revenue trends from 2014 to 2024.
Cisco's cost of revenue has shown a steady pattern, peaking in 2023 with a 10% increase from 2014. This reflects Cisco's strategic investments in innovation and infrastructure. Meanwhile, Workday's cost of revenue has surged by nearly 900% over the same period, highlighting its rapid expansion and scaling efforts.
The data reveals Cisco's consistent approach, maintaining a mean cost of revenue around $18.9 billion, while Workday's mean stands at approximately $903 million, underscoring the different scales and growth trajectories of these tech giants. As the industry continues to evolve, these insights offer a window into the financial strategies shaping the future of technology.
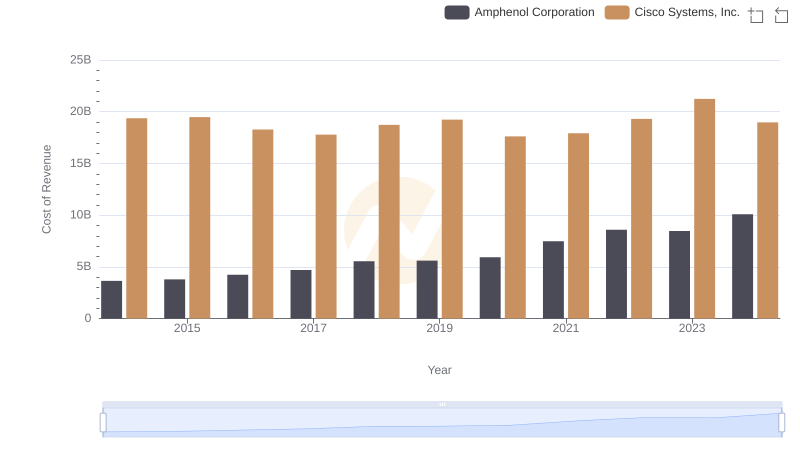
Cost of Revenue Trends: Cisco Systems, Inc. vs Amphenol Corporation
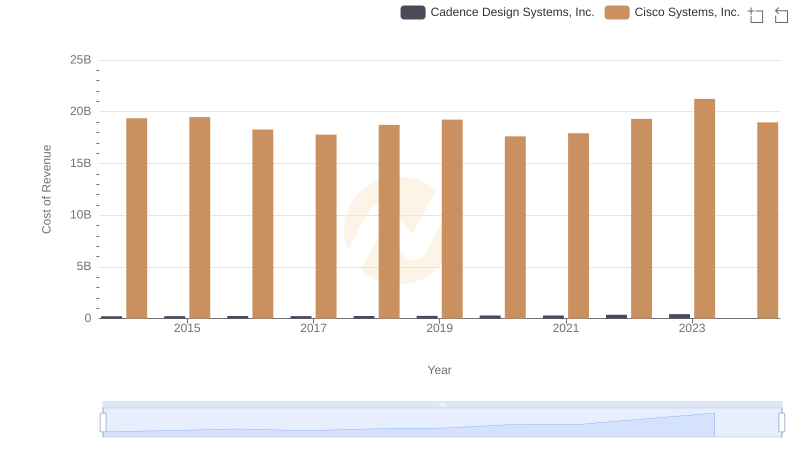
Cost of Revenue: Key Insights for Cisco Systems, Inc. and Cadence Design Systems, Inc.
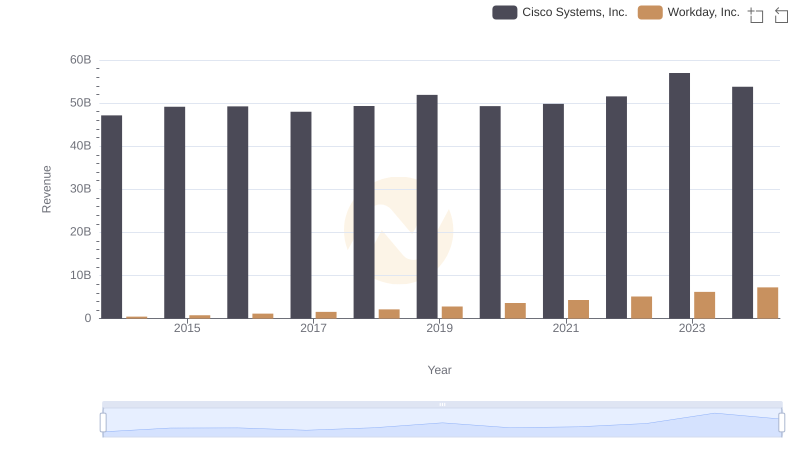
Breaking Down Revenue Trends: Cisco Systems, Inc. vs Workday, Inc.
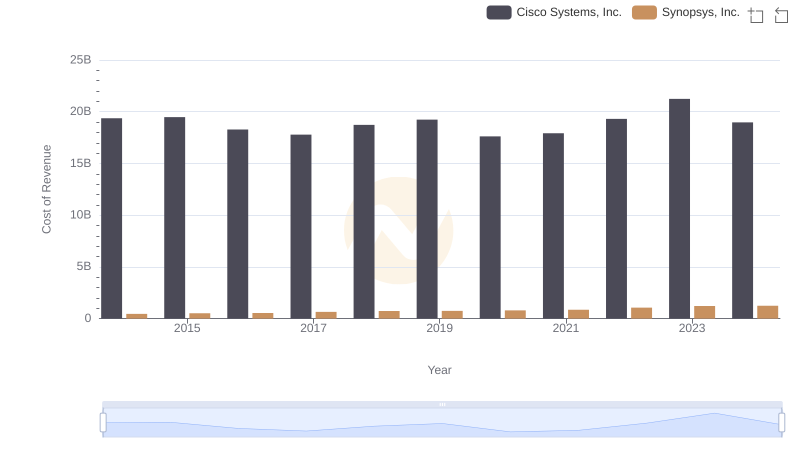
Cost of Revenue: Key Insights for Cisco Systems, Inc. and Synopsys, Inc.
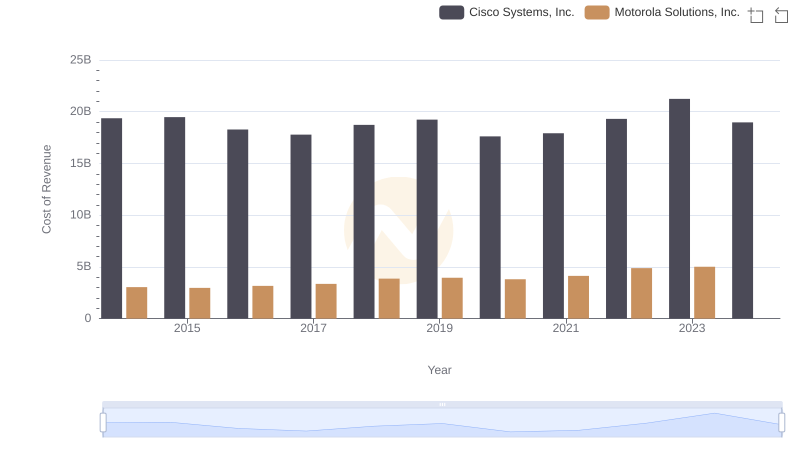
Cost of Revenue Comparison: Cisco Systems, Inc. vs Motorola Solutions, Inc.
Comparing Cost of Revenue Efficiency: Cisco Systems, Inc. vs Fortinet, Inc.
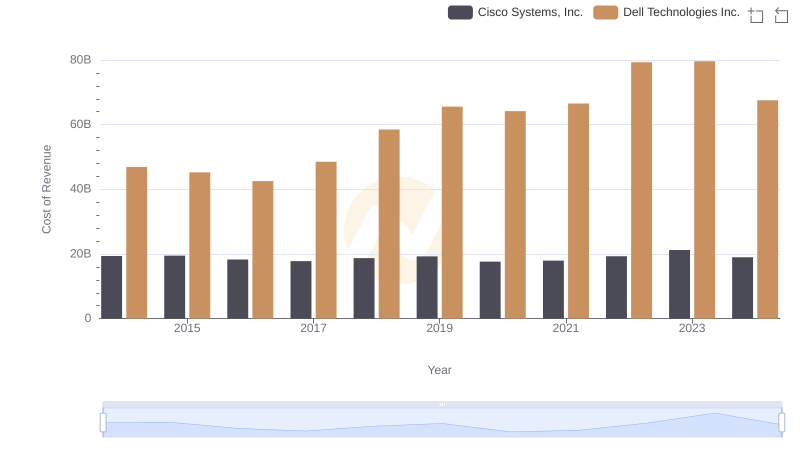
Cost of Revenue: Key Insights for Cisco Systems, Inc. and Dell Technologies Inc.
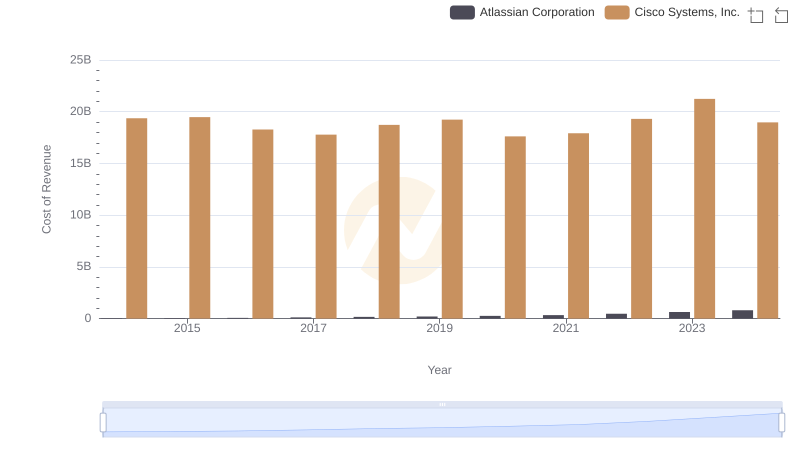
Cost of Revenue Comparison: Cisco Systems, Inc. vs Atlassian Corporation
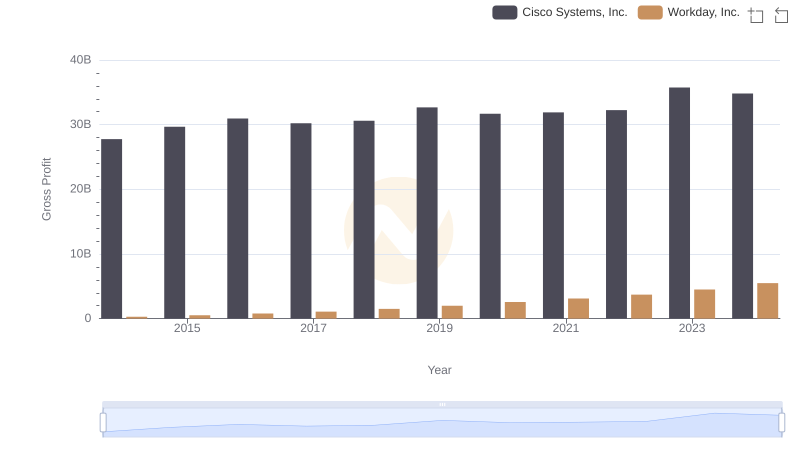
Who Generates Higher Gross Profit? Cisco Systems, Inc. or Workday, Inc.
Cost Insights: Breaking Down Cisco Systems, Inc. and Autodesk, Inc.'s Expenses

R&D Spending Showdown: Cisco Systems, Inc. vs Workday, Inc.
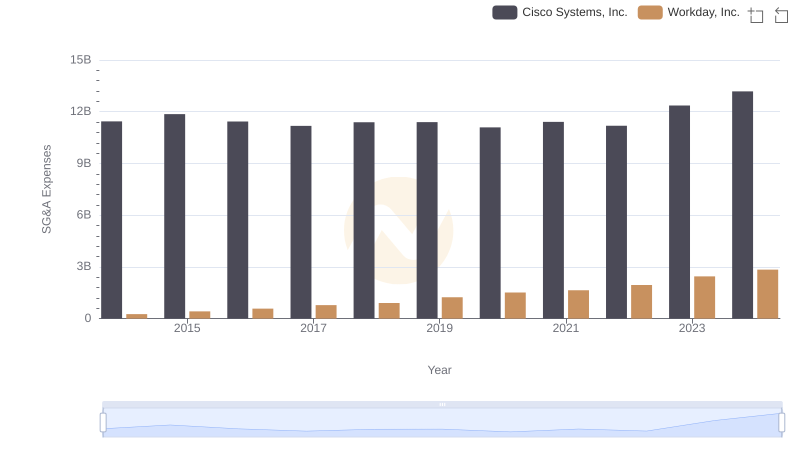
Comparing SG&A Expenses: Cisco Systems, Inc. vs Workday, Inc. Trends and Insights