| __timestamp | Atlassian Corporation | Cisco Systems, Inc. |
|---|---|---|
| Wednesday, January 1, 2014 | 37986000 | 19373000000 |
| Thursday, January 1, 2015 | 52932000 | 19480000000 |
| Friday, January 1, 2016 | 75783000 | 18287000000 |
| Sunday, January 1, 2017 | 119161000 | 17781000000 |
| Monday, January 1, 2018 | 172690000 | 18724000000 |
| Tuesday, January 1, 2019 | 210285000 | 19238000000 |
| Wednesday, January 1, 2020 | 268807000 | 17618000000 |
| Friday, January 1, 2021 | 336021000 | 17924000000 |
| Saturday, January 1, 2022 | 465707000 | 19309000000 |
| Sunday, January 1, 2023 | 633765000 | 21245000000 |
| Monday, January 1, 2024 | 803495000 | 18975000000 |
Data in motion
In the ever-evolving tech landscape, Cisco Systems, Inc. and Atlassian Corporation stand as titans with distinct trajectories. Over the past decade, Cisco's cost of revenue has shown remarkable stability, fluctuating around $19 billion annually. In contrast, Atlassian's cost of revenue has surged by over 2,000%, from approximately $38 million in 2014 to an impressive $803 million in 2024.
Cisco's consistent cost of revenue reflects its established market presence and operational efficiency. Meanwhile, Atlassian's exponential growth underscores its aggressive expansion and increasing market share in the software industry. This divergence highlights the contrasting strategies of a mature tech giant versus a rapidly growing innovator.
As we move into 2024, these trends offer valuable insights into the strategic priorities of these companies, with Cisco focusing on stability and Atlassian on growth.
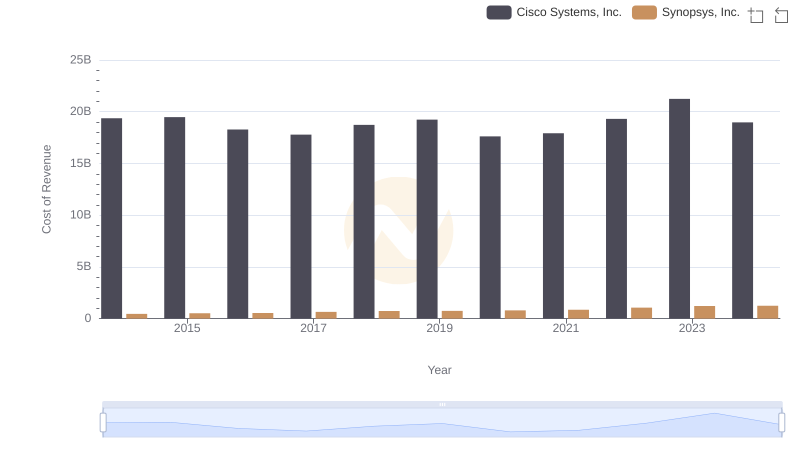
Cost of Revenue: Key Insights for Cisco Systems, Inc. and Synopsys, Inc.
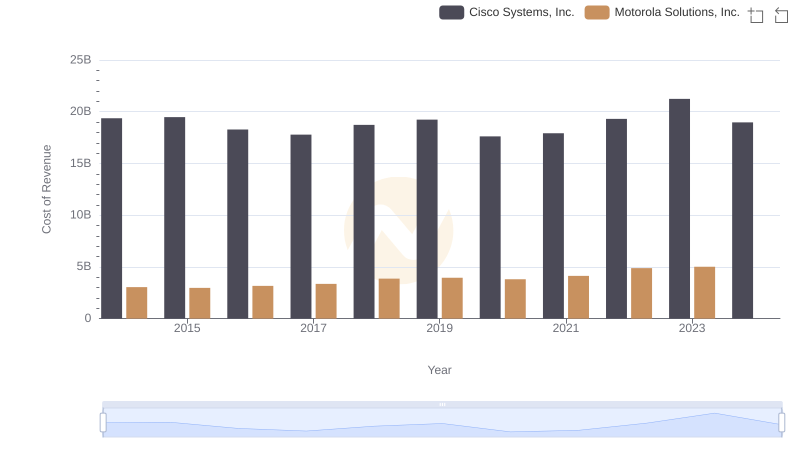
Cost of Revenue Comparison: Cisco Systems, Inc. vs Motorola Solutions, Inc.
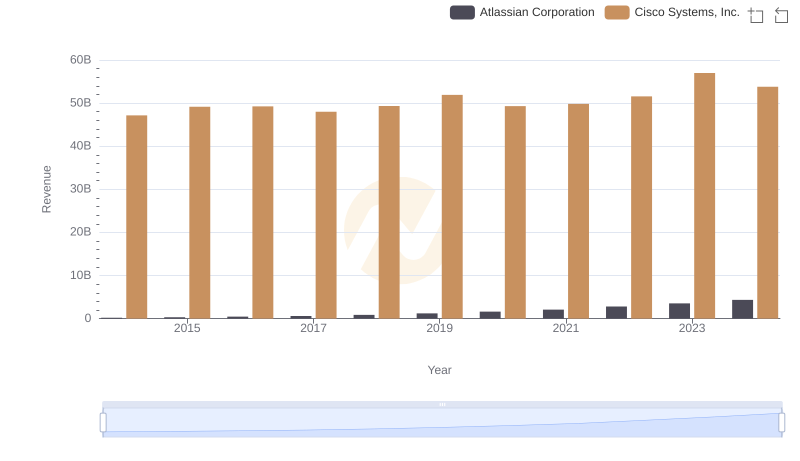
Breaking Down Revenue Trends: Cisco Systems, Inc. vs Atlassian Corporation
Comparing Cost of Revenue Efficiency: Cisco Systems, Inc. vs Fortinet, Inc.
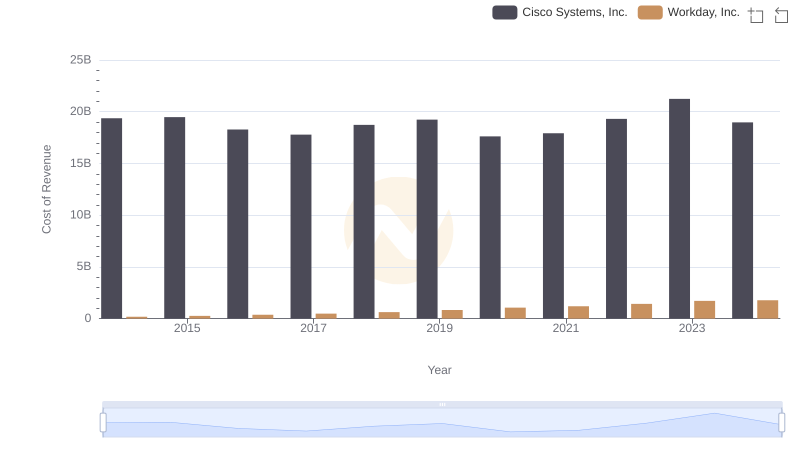
Cost of Revenue: Key Insights for Cisco Systems, Inc. and Workday, Inc.
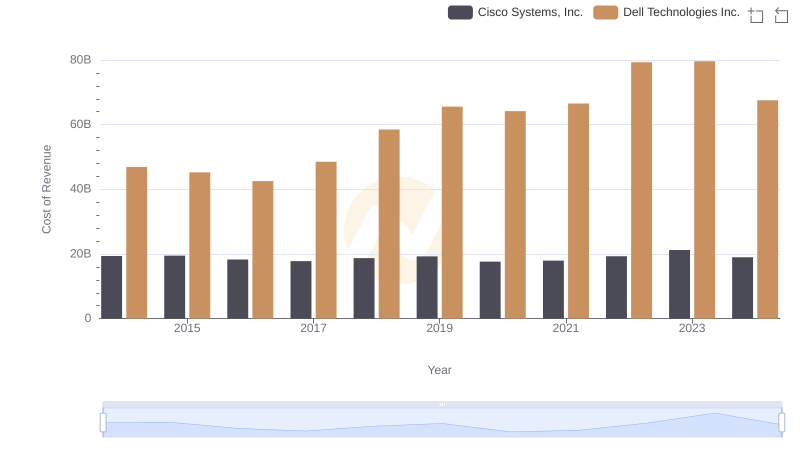
Cost of Revenue: Key Insights for Cisco Systems, Inc. and Dell Technologies Inc.
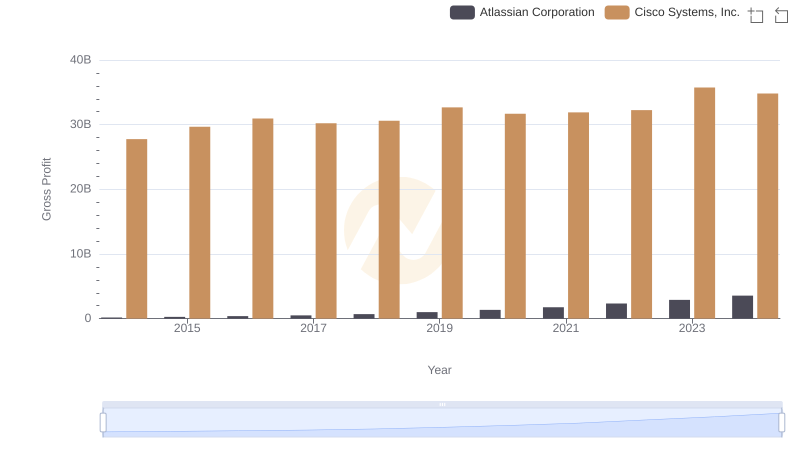
Gross Profit Comparison: Cisco Systems, Inc. and Atlassian Corporation Trends
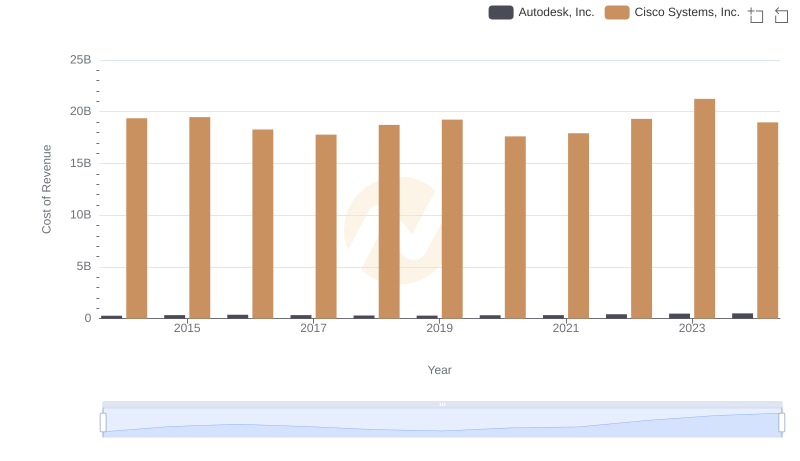
Cost Insights: Breaking Down Cisco Systems, Inc. and Autodesk, Inc.'s Expenses
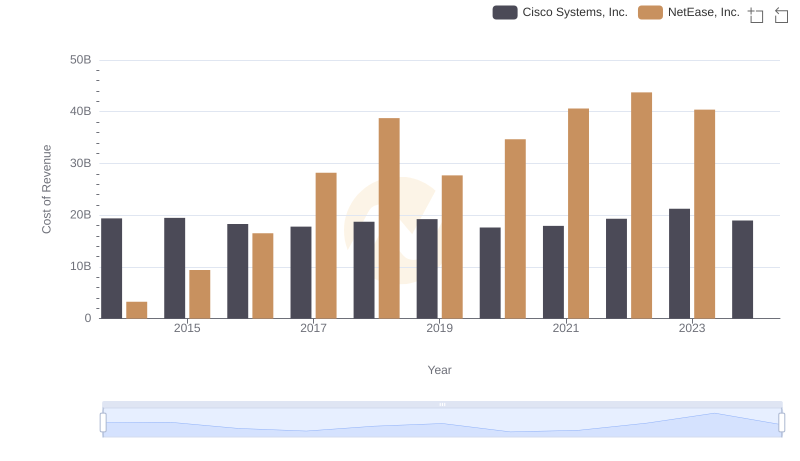
Cost of Revenue: Key Insights for Cisco Systems, Inc. and NetEase, Inc.
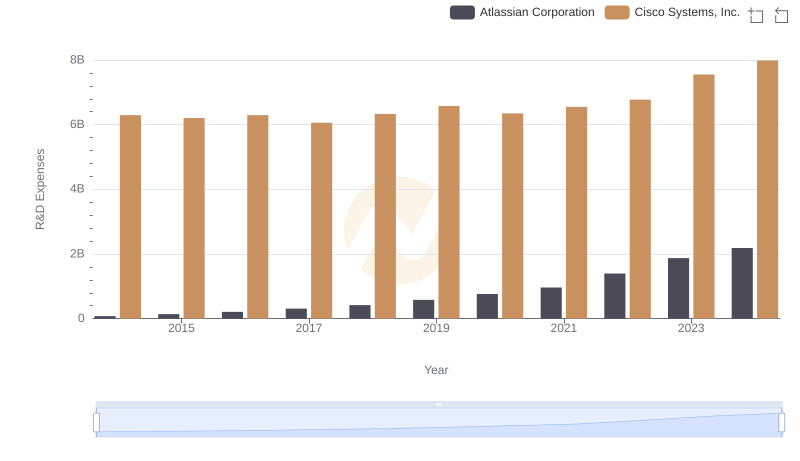
R&D Insights: How Cisco Systems, Inc. and Atlassian Corporation Allocate Funds

Cost of Revenue Comparison: Cisco Systems, Inc. vs Block, Inc.
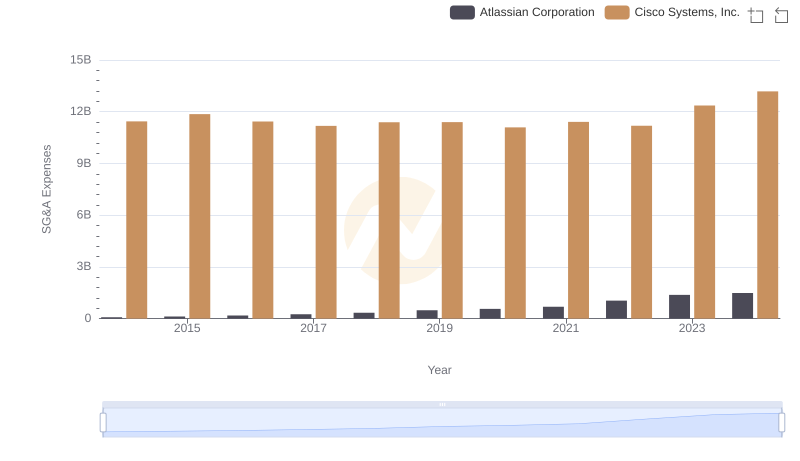
Comparing SG&A Expenses: Cisco Systems, Inc. vs Atlassian Corporation Trends and Insights