| __timestamp | AMETEK, Inc. | Axon Enterprise, Inc. |
|---|---|---|
| Wednesday, January 1, 2014 | 4021964000 | 164525000 |
| Thursday, January 1, 2015 | 3974295000 | 197892000 |
| Friday, January 1, 2016 | 3840087000 | 268245000 |
| Sunday, January 1, 2017 | 4300170000 | 343798000 |
| Monday, January 1, 2018 | 4845872000 | 420068000 |
| Tuesday, January 1, 2019 | 5158557000 | 530860000 |
| Wednesday, January 1, 2020 | 4540029000 | 681003000 |
| Friday, January 1, 2021 | 5546514000 | 863381000 |
| Saturday, January 1, 2022 | 6150530000 | 1189935000 |
| Sunday, January 1, 2023 | 6596950000 | 1563391000 |
| Monday, January 1, 2024 | 6941180000 |
In pursuit of knowledge
In the ever-evolving landscape of technology and manufacturing, Axon Enterprise, Inc. and AMETEK, Inc. have showcased remarkable growth over the past decade. From 2014 to 2023, AMETEK, Inc. has consistently outperformed Axon in terms of revenue, with a staggering 64% increase, reaching its peak in 2023. Meanwhile, Axon Enterprise, Inc. has demonstrated an impressive growth trajectory, with its revenue surging by over 800% during the same period.
This comparison highlights the dynamic nature of these industries and the potential for growth through strategic innovation and market adaptation.
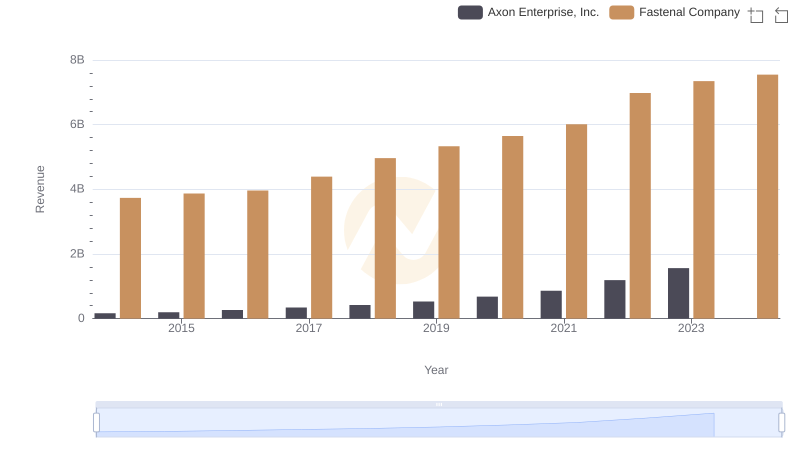
Comparing Revenue Performance: Axon Enterprise, Inc. or Fastenal Company?
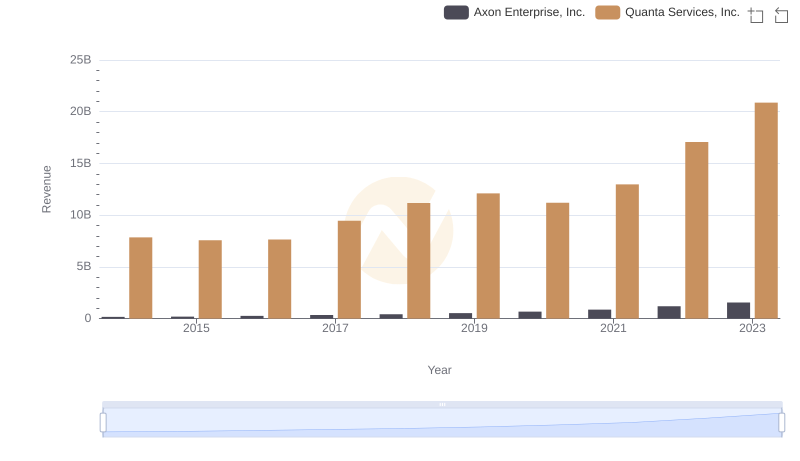
Breaking Down Revenue Trends: Axon Enterprise, Inc. vs Quanta Services, Inc.
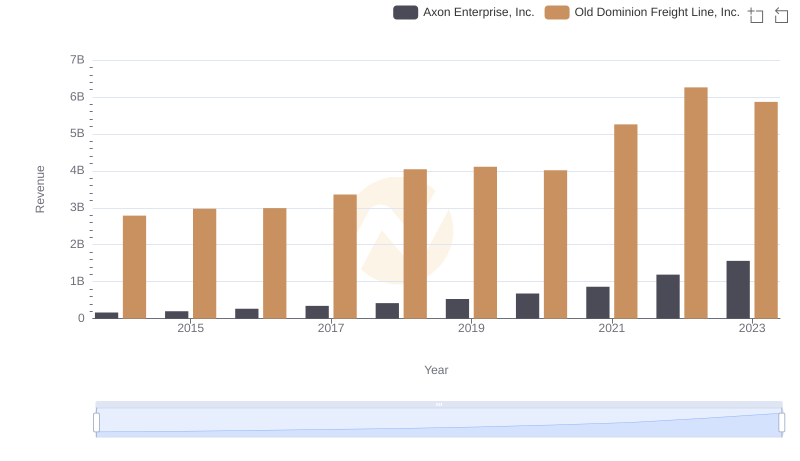
Comparing Revenue Performance: Axon Enterprise, Inc. or Old Dominion Freight Line, Inc.?
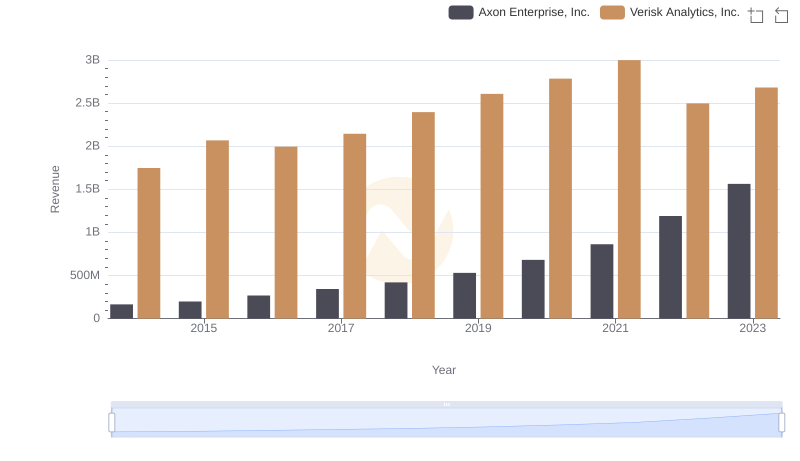
Axon Enterprise, Inc. or Verisk Analytics, Inc.: Who Leads in Yearly Revenue?
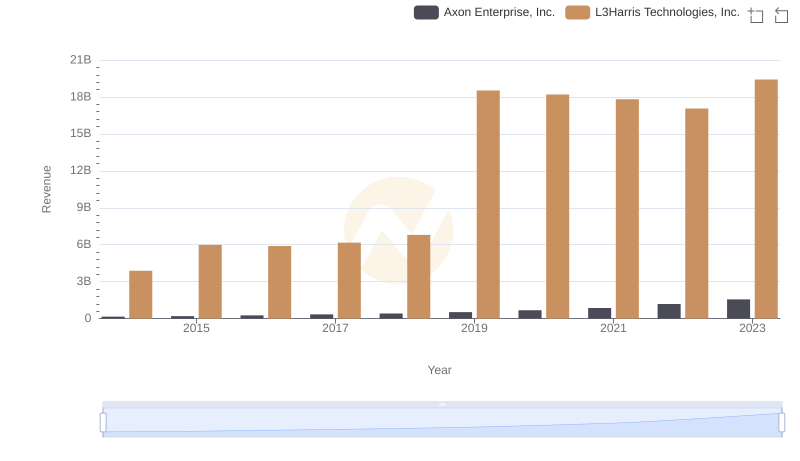
Annual Revenue Comparison: Axon Enterprise, Inc. vs L3Harris Technologies, Inc.
Axon Enterprise, Inc. vs Ingersoll Rand Inc.: Annual Revenue Growth Compared

Who Generates More Revenue? Axon Enterprise, Inc. or Ferguson plc
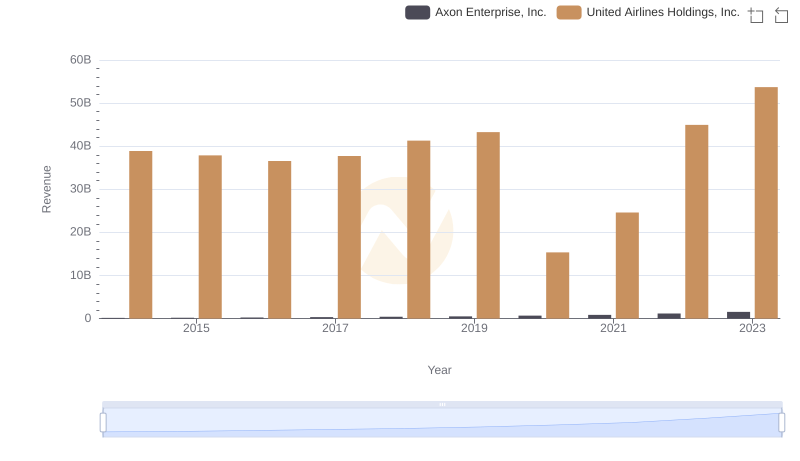
Annual Revenue Comparison: Axon Enterprise, Inc. vs United Airlines Holdings, Inc.
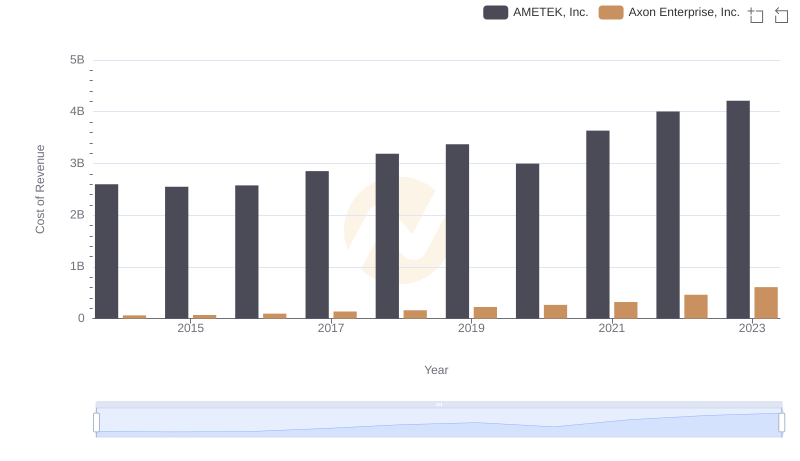
Cost of Revenue: Key Insights for Axon Enterprise, Inc. and AMETEK, Inc.

Gross Profit Trends Compared: Axon Enterprise, Inc. vs AMETEK, Inc.
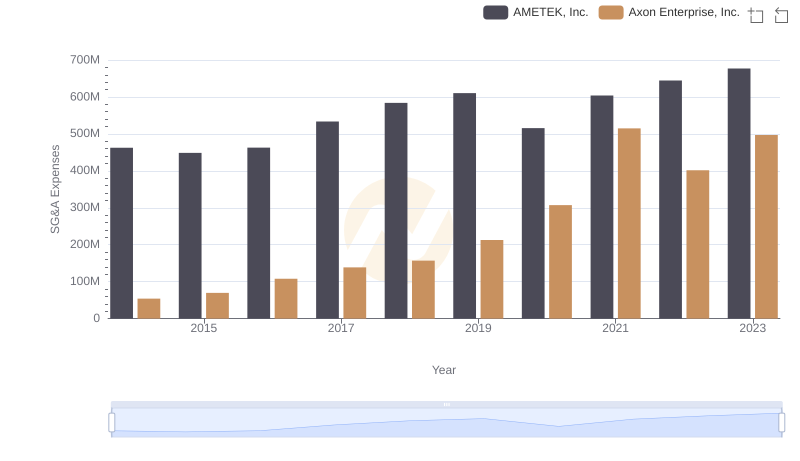
SG&A Efficiency Analysis: Comparing Axon Enterprise, Inc. and AMETEK, Inc.