| __timestamp | ITT Inc. | Watsco, Inc. |
|---|---|---|
| Wednesday, January 1, 2014 | 519500000 | 650655000 |
| Thursday, January 1, 2015 | 441500000 | 670609000 |
| Friday, January 1, 2016 | 444100000 | 688952000 |
| Sunday, January 1, 2017 | 433700000 | 715671000 |
| Monday, January 1, 2018 | 427300000 | 757452000 |
| Tuesday, January 1, 2019 | 420000000 | 800328000 |
| Wednesday, January 1, 2020 | 347200000 | 833051000 |
| Friday, January 1, 2021 | 365100000 | 1058316000 |
| Saturday, January 1, 2022 | 368500000 | 1221382000 |
| Sunday, January 1, 2023 | 476600000 | 1185626000 |
| Monday, January 1, 2024 | 502300000 | 1262938000 |
Unlocking the unknown
In the competitive landscape of industrial giants, managing Selling, General, and Administrative (SG&A) expenses is crucial for profitability. Over the past decade, Watsco, Inc. and ITT Inc. have shown contrasting trends in their SG&A management. From 2014 to 2023, Watsco's SG&A expenses surged by approximately 82%, reflecting its aggressive expansion strategy. In contrast, ITT Inc. managed to reduce its SG&A costs by about 8% during the same period, showcasing its efficiency in cost management.
Watsco's expenses peaked in 2022, reaching nearly double the amount of ITT's highest recorded expenses in 2014. Meanwhile, ITT's strategic cost-cutting measures have kept its expenses relatively stable, with a notable dip in 2020. This data highlights the different financial strategies employed by these companies, offering valuable insights for investors and industry analysts.
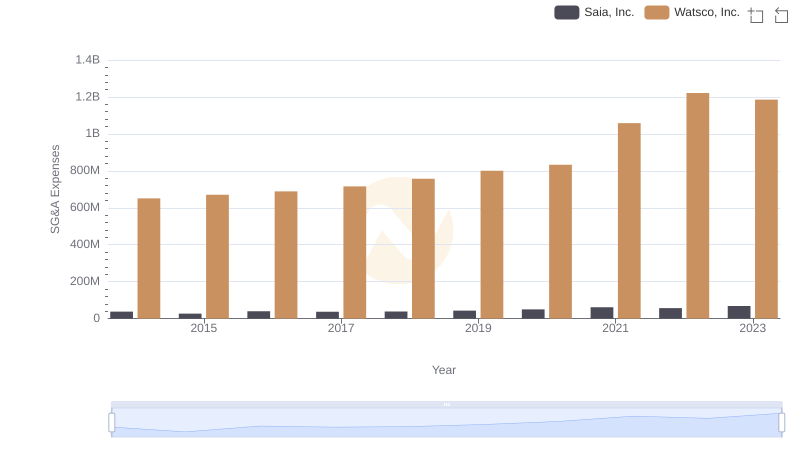
Breaking Down SG&A Expenses: Watsco, Inc. vs Saia, Inc.
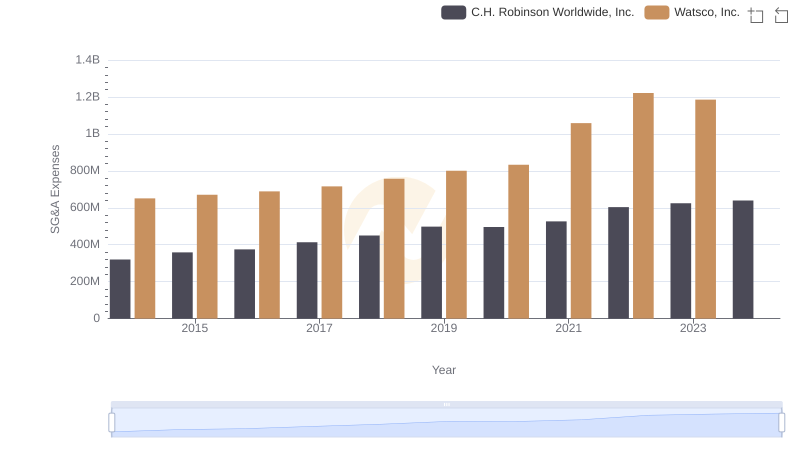
Watsco, Inc. or C.H. Robinson Worldwide, Inc.: Who Manages SG&A Costs Better?
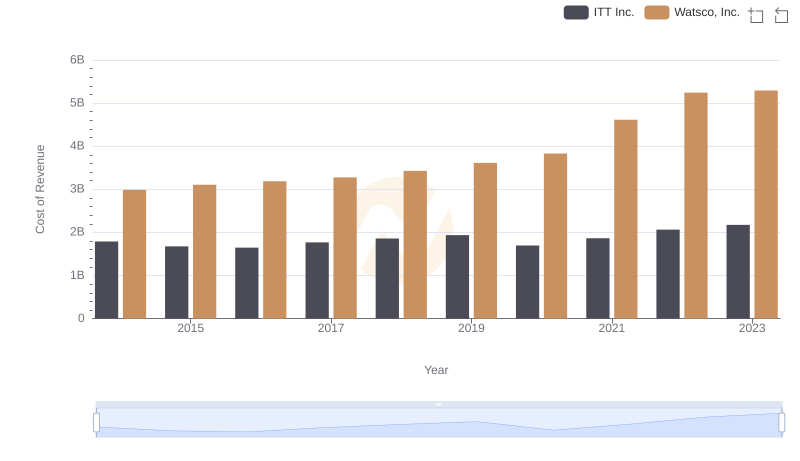
Cost of Revenue Comparison: Watsco, Inc. vs ITT Inc.
Operational Costs Compared: SG&A Analysis of Watsco, Inc. and Clean Harbors, Inc.
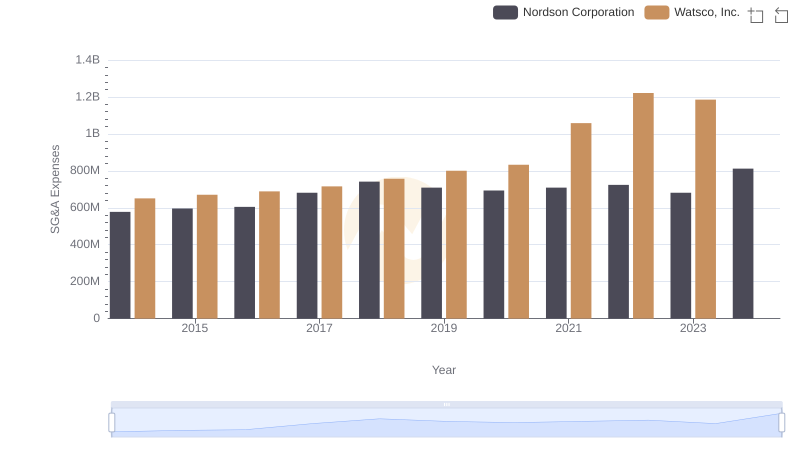
Who Optimizes SG&A Costs Better? Watsco, Inc. or Nordson Corporation
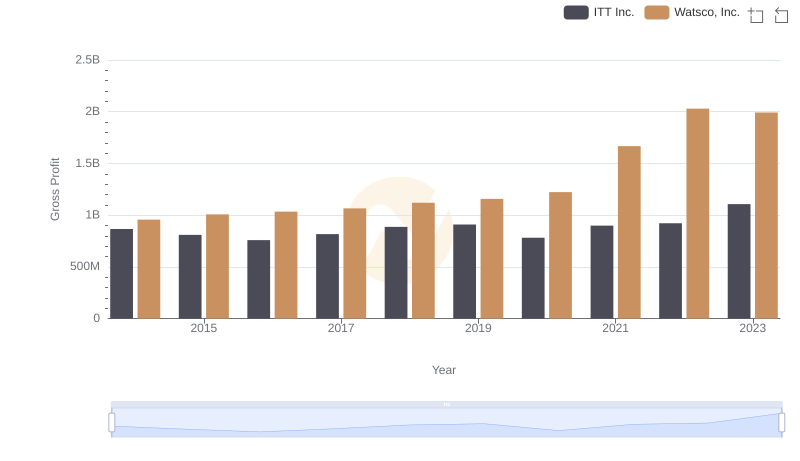
Key Insights on Gross Profit: Watsco, Inc. vs ITT Inc.
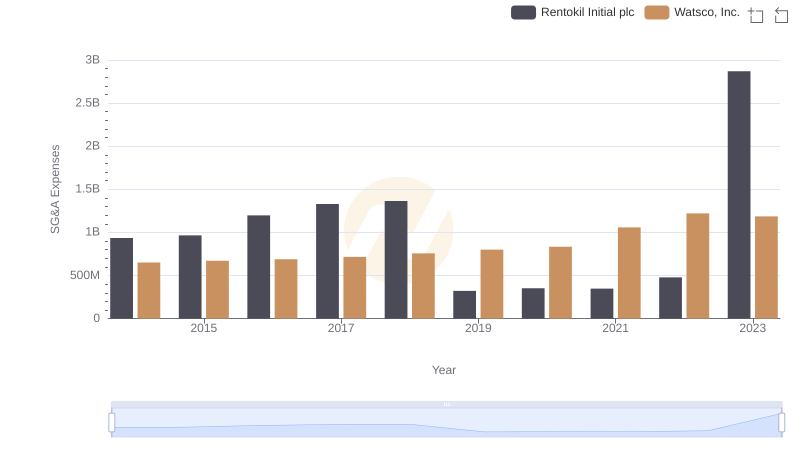
SG&A Efficiency Analysis: Comparing Watsco, Inc. and Rentokil Initial plc