| __timestamp | ITT Inc. | Watsco, Inc. |
|---|---|---|
| Wednesday, January 1, 2014 | 866400000 | 956402000 |
| Thursday, January 1, 2015 | 809100000 | 1007357000 |
| Friday, January 1, 2016 | 758200000 | 1034584000 |
| Sunday, January 1, 2017 | 817200000 | 1065659000 |
| Monday, January 1, 2018 | 887200000 | 1120252000 |
| Tuesday, January 1, 2019 | 910100000 | 1156956000 |
| Wednesday, January 1, 2020 | 782200000 | 1222821000 |
| Friday, January 1, 2021 | 899500000 | 1667545000 |
| Saturday, January 1, 2022 | 922300000 | 2030289000 |
| Sunday, January 1, 2023 | 1107300000 | 1992140000 |
| Monday, January 1, 2024 | 1247300000 | 2044713000 |
Unleashing the power of data
In the competitive landscape of industrial giants, Watsco, Inc. and ITT Inc. have showcased remarkable financial trajectories over the past decade. From 2014 to 2023, Watsco, Inc. has consistently outperformed ITT Inc. in terms of gross profit, with a notable 110% increase, peaking at approximately $2 billion in 2022. Meanwhile, ITT Inc. demonstrated a steady growth of around 28%, reaching its highest gross profit of about $1.1 billion in 2023.
These insights highlight the dynamic shifts in the industrial sector, with Watsco, Inc. leading the charge in profitability growth.
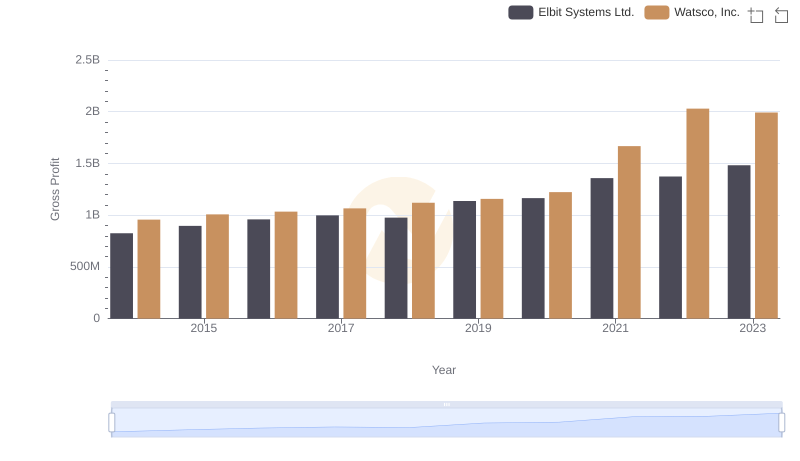
Gross Profit Analysis: Comparing Watsco, Inc. and Elbit Systems Ltd.

Gross Profit Comparison: Watsco, Inc. and Curtiss-Wright Corporation Trends
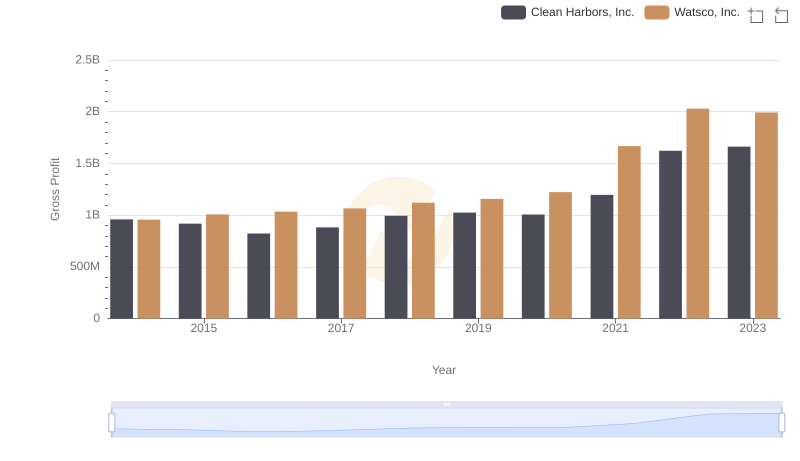
Gross Profit Trends Compared: Watsco, Inc. vs Clean Harbors, Inc.
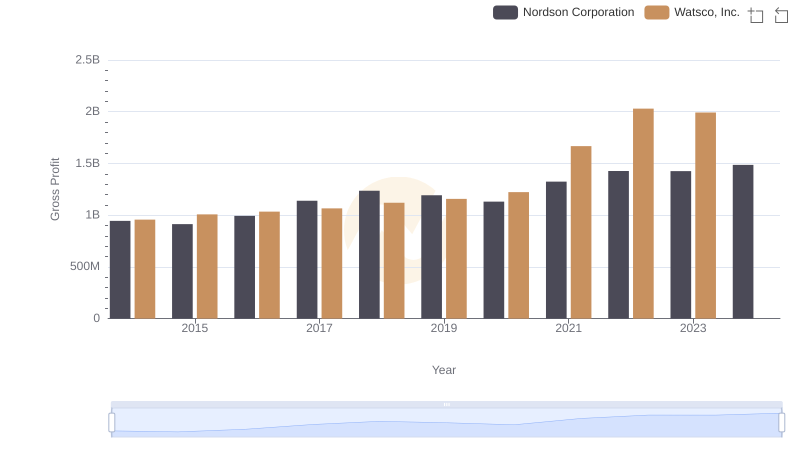
Watsco, Inc. and Nordson Corporation: A Detailed Gross Profit Analysis
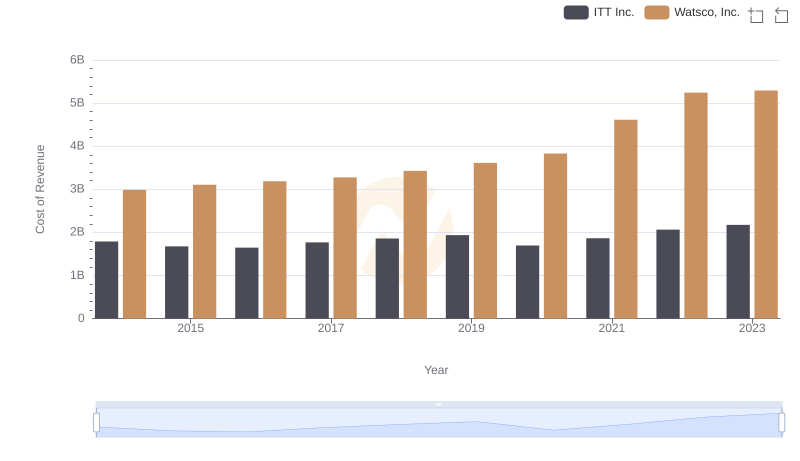
Cost of Revenue Comparison: Watsco, Inc. vs ITT Inc.
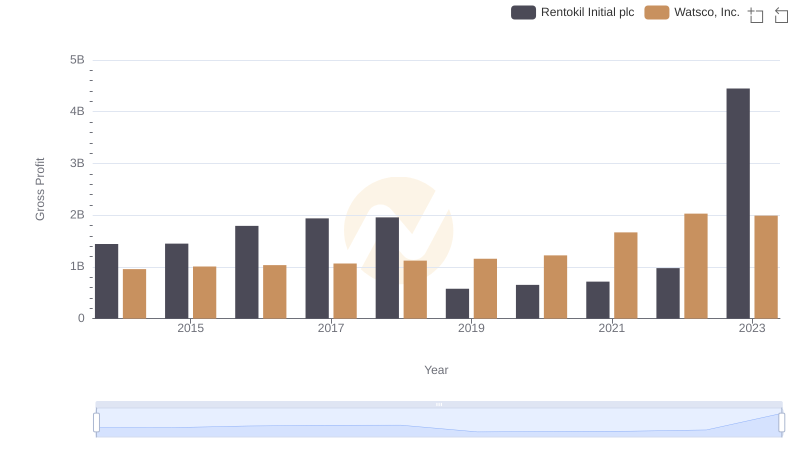
Gross Profit Trends Compared: Watsco, Inc. vs Rentokil Initial plc
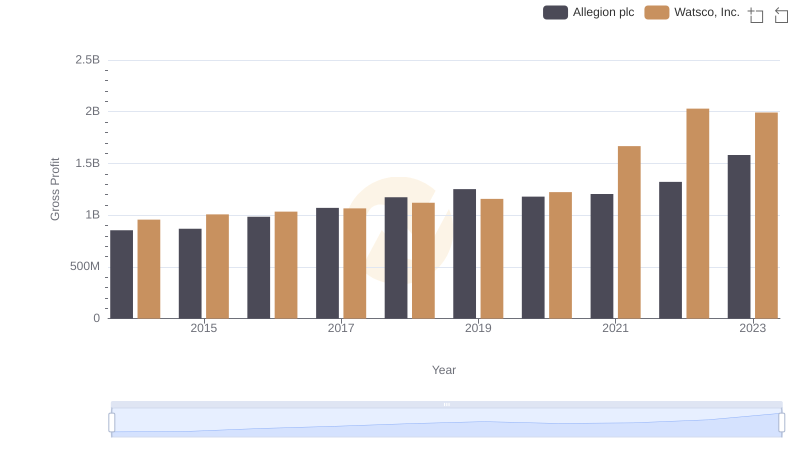
Who Generates Higher Gross Profit? Watsco, Inc. or Allegion plc
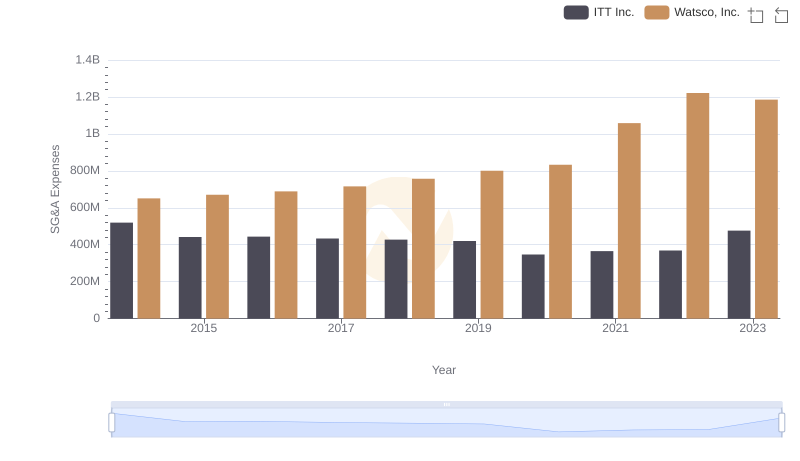
Watsco, Inc. or ITT Inc.: Who Manages SG&A Costs Better?
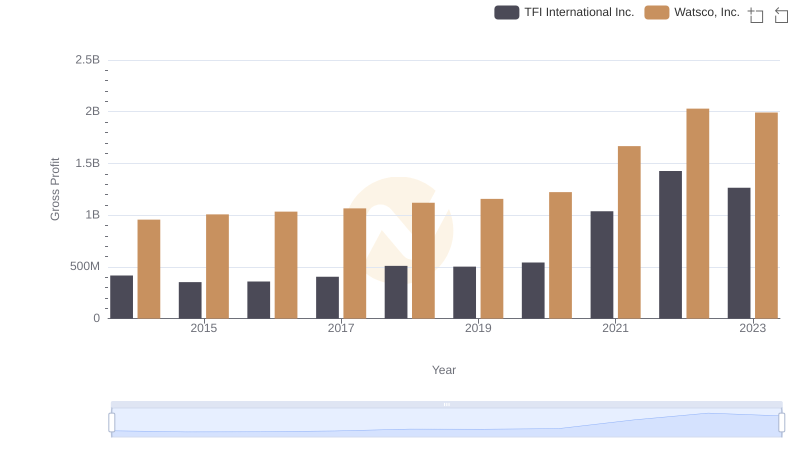
Key Insights on Gross Profit: Watsco, Inc. vs TFI International Inc.