| __timestamp | Southwest Airlines Co. | Waste Connections, Inc. |
|---|---|---|
| Wednesday, January 1, 2014 | 18605000000 | 2079166000 |
| Thursday, January 1, 2015 | 19820000000 | 2117287000 |
| Friday, January 1, 2016 | 20425000000 | 3375863000 |
| Sunday, January 1, 2017 | 21171000000 | 4630488000 |
| Monday, January 1, 2018 | 21965000000 | 4922941000 |
| Tuesday, January 1, 2019 | 22428000000 | 5388679000 |
| Wednesday, January 1, 2020 | 9048000000 | 5445990000 |
| Friday, January 1, 2021 | 15790000000 | 6151361000 |
| Saturday, January 1, 2022 | 23814000000 | 7211859000 |
| Sunday, January 1, 2023 | 26091000000 | 8021951000 |
| Monday, January 1, 2024 | 27483000000 | 8919591000 |
Cracking the code
In the ever-evolving landscape of American business, Waste Connections, Inc. and Southwest Airlines Co. offer a fascinating study in contrasts. Over the past decade, Southwest Airlines has soared, with revenue peaking at approximately $26 billion in 2023, a remarkable 40% increase from 2014. However, the pandemic year of 2020 saw a dramatic dip, with revenues plummeting by nearly 60% compared to the previous year.
Conversely, Waste Connections, Inc. has steadily climbed, with revenues growing by nearly 300% from 2014 to 2023. This growth underscores the resilience of the waste management sector, even amidst global disruptions. By 2023, Waste Connections' revenue reached over $8 billion, highlighting its robust expansion.
This comparison not only reflects the diverse challenges and opportunities faced by these industries but also offers insights into their strategic adaptations over time.
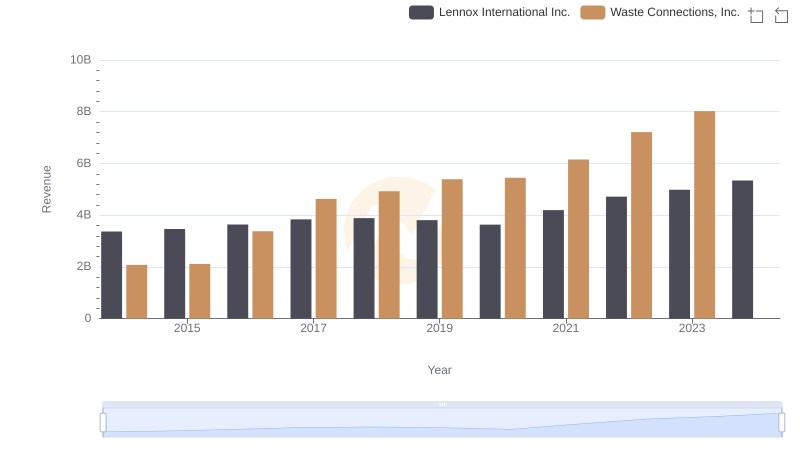
Revenue Insights: Waste Connections, Inc. and Lennox International Inc. Performance Compared
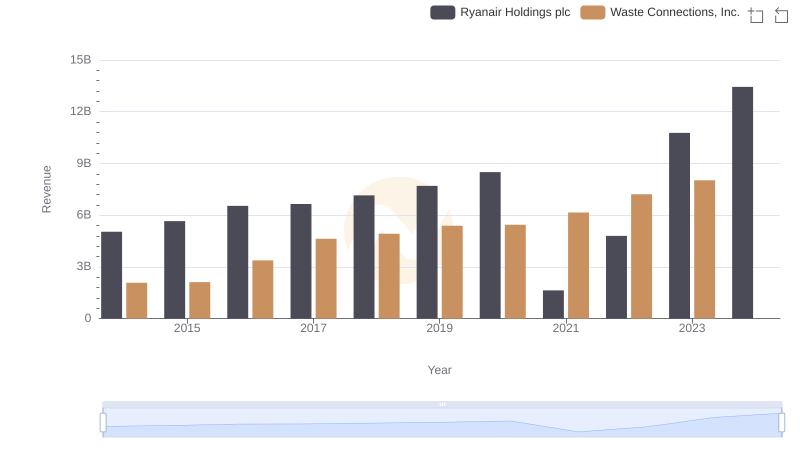
Waste Connections, Inc. vs Ryanair Holdings plc: Examining Key Revenue Metrics
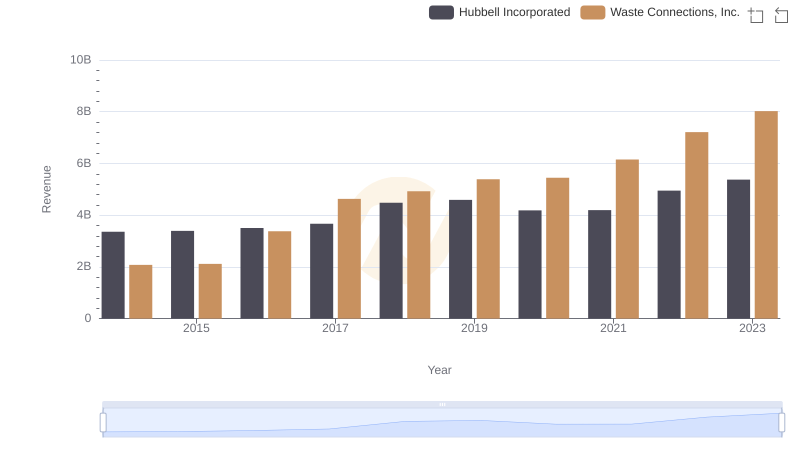
Annual Revenue Comparison: Waste Connections, Inc. vs Hubbell Incorporated
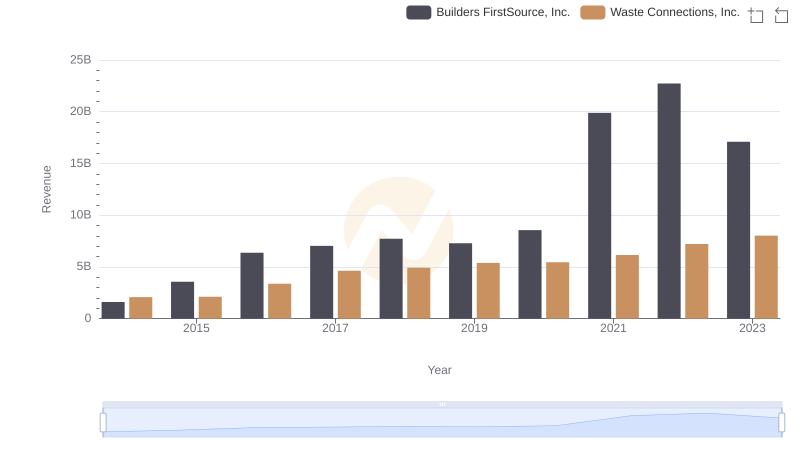
Who Generates More Revenue? Waste Connections, Inc. or Builders FirstSource, Inc.
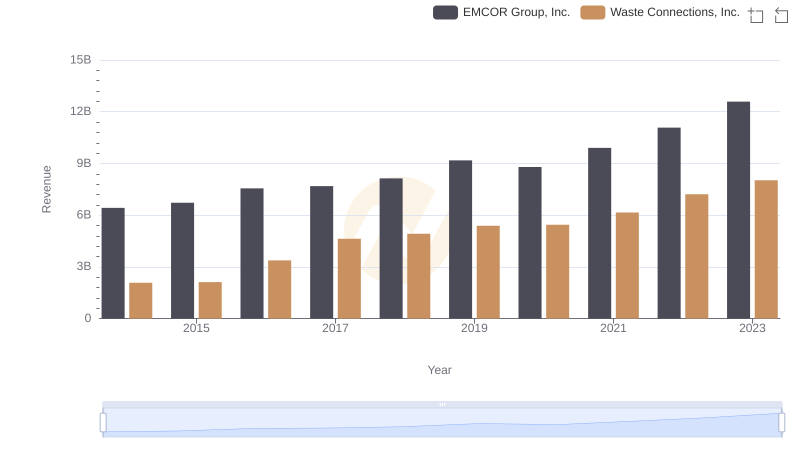
Breaking Down Revenue Trends: Waste Connections, Inc. vs EMCOR Group, Inc.
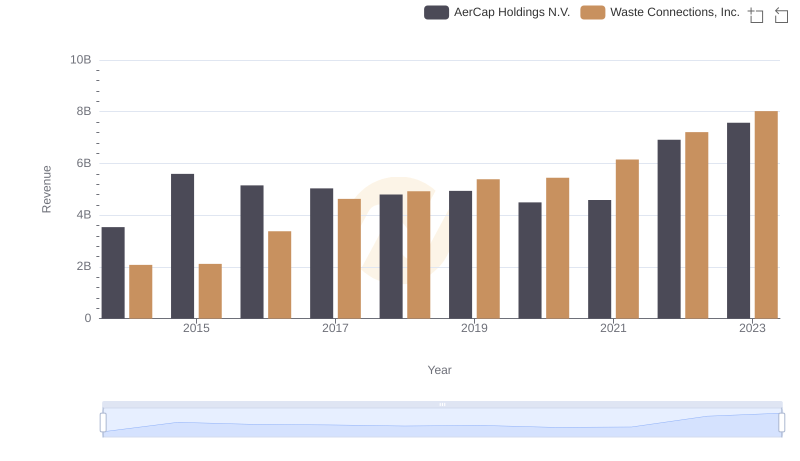
Revenue Showdown: Waste Connections, Inc. vs AerCap Holdings N.V.
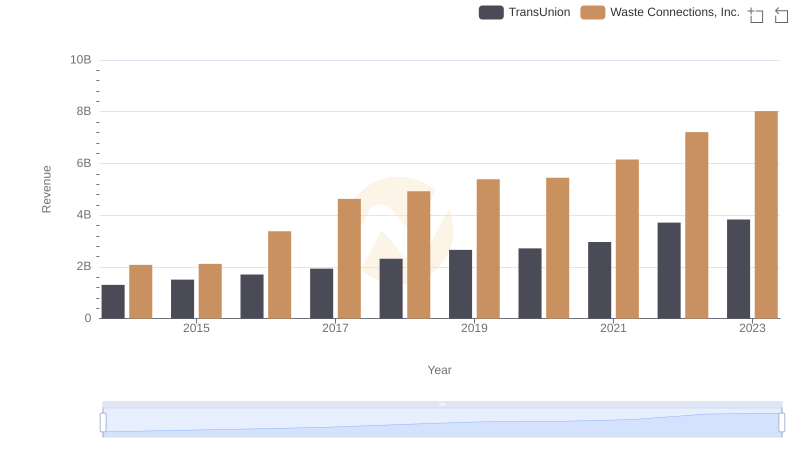
Comparing Revenue Performance: Waste Connections, Inc. or TransUnion?
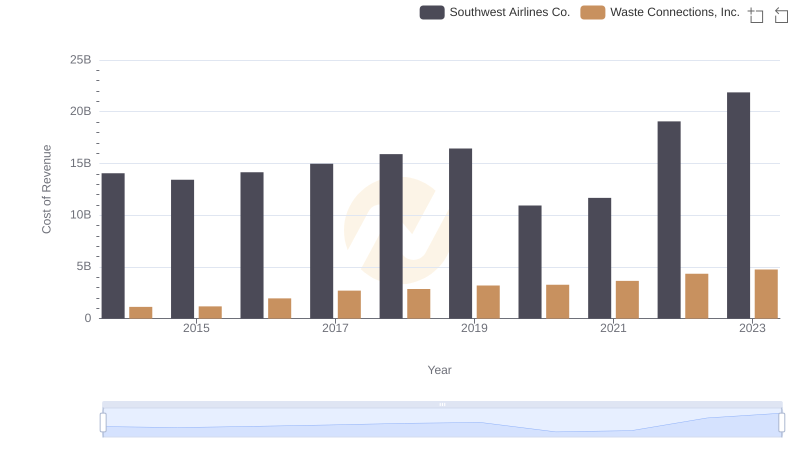
Cost of Revenue Comparison: Waste Connections, Inc. vs Southwest Airlines Co.
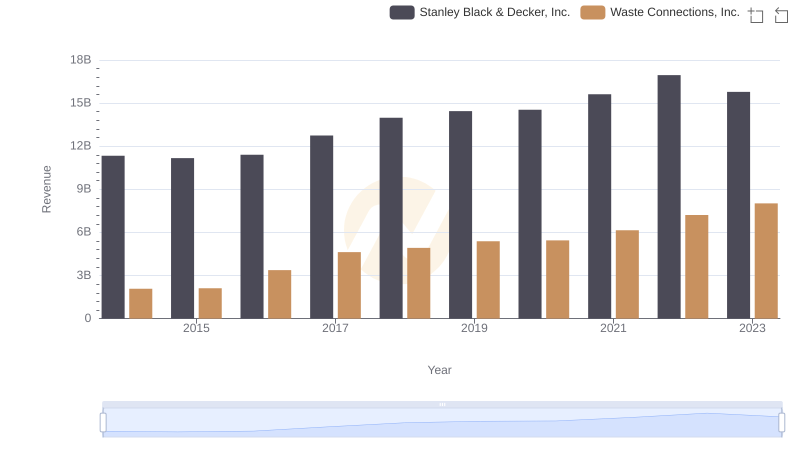
Comparing Revenue Performance: Waste Connections, Inc. or Stanley Black & Decker, Inc.?