| __timestamp | Snap-on Incorporated | Waste Connections, Inc. |
|---|---|---|
| Wednesday, January 1, 2014 | 1693400000 | 1138388000 |
| Thursday, January 1, 2015 | 1704500000 | 1177409000 |
| Friday, January 1, 2016 | 1720800000 | 1957712000 |
| Sunday, January 1, 2017 | 1862000000 | 2704775000 |
| Monday, January 1, 2018 | 1870700000 | 2865704000 |
| Tuesday, January 1, 2019 | 1886000000 | 3198757000 |
| Wednesday, January 1, 2020 | 1844000000 | 3276808000 |
| Friday, January 1, 2021 | 2141200000 | 3654074000 |
| Saturday, January 1, 2022 | 2311700000 | 4336012000 |
| Sunday, January 1, 2023 | 2488500000 | 4744513000 |
| Monday, January 1, 2024 | 2329500000 | 5191706000 |
Infusing magic into the data realm
In the ever-evolving landscape of corporate efficiency, Waste Connections, Inc. and Snap-on Incorporated present a fascinating study in cost management. Over the past decade, from 2014 to 2023, these two industry giants have demonstrated distinct trajectories in their cost of revenue. Waste Connections, Inc. has seen a remarkable increase of over 316% in its cost of revenue, reflecting its aggressive expansion and operational scaling. In contrast, Snap-on Incorporated has maintained a more conservative growth of approximately 47%, showcasing its steady and controlled approach to cost management.
This comparison highlights the strategic differences between a waste management leader and a tool manufacturing titan. As Waste Connections, Inc. continues to expand its footprint, Snap-on Incorporated remains a paragon of stability. This data offers valuable insights for investors and industry analysts seeking to understand the dynamics of cost efficiency in diverse sectors.
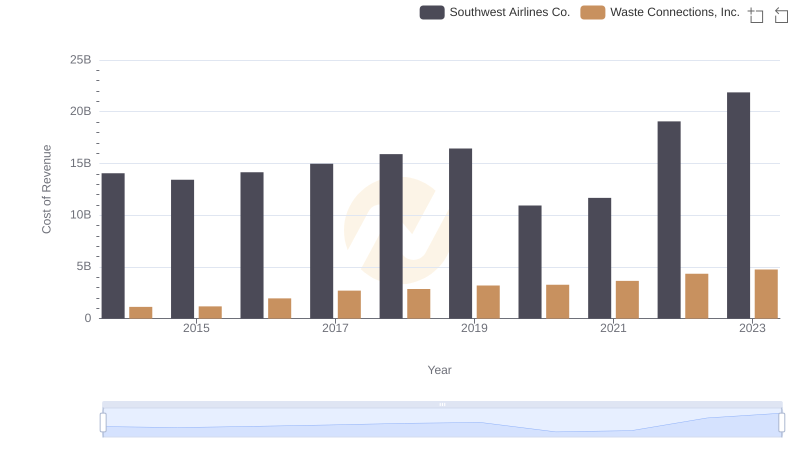
Cost of Revenue Comparison: Waste Connections, Inc. vs Southwest Airlines Co.
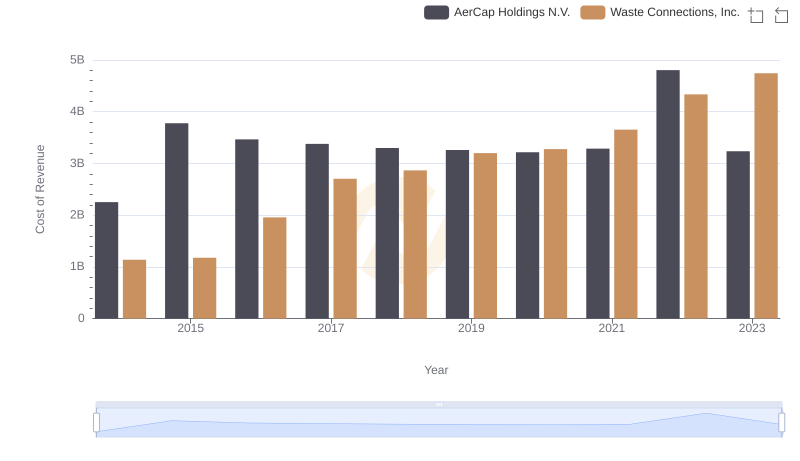
Cost Insights: Breaking Down Waste Connections, Inc. and AerCap Holdings N.V.'s Expenses
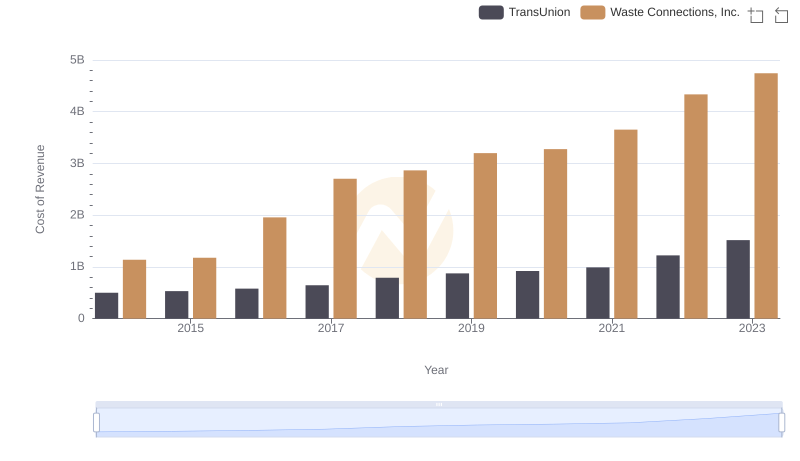
Cost of Revenue Comparison: Waste Connections, Inc. vs TransUnion
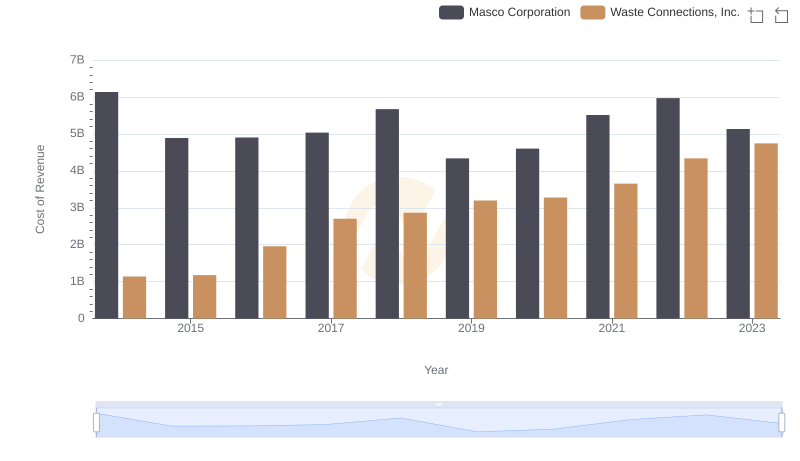
Cost of Revenue Comparison: Waste Connections, Inc. vs Masco Corporation
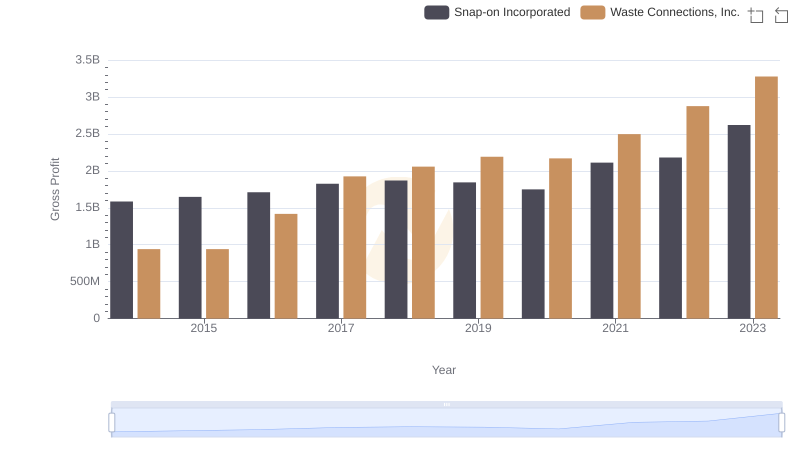
Waste Connections, Inc. vs Snap-on Incorporated: A Gross Profit Performance Breakdown
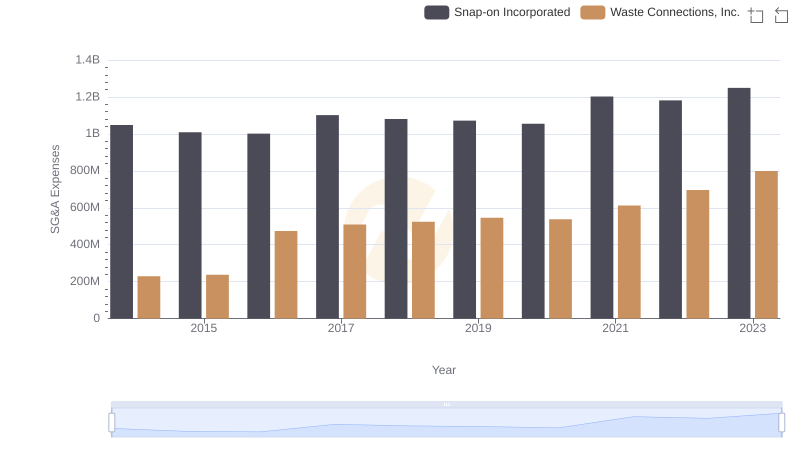
Operational Costs Compared: SG&A Analysis of Waste Connections, Inc. and Snap-on Incorporated