| __timestamp | EMCOR Group, Inc. | Waste Connections, Inc. |
|---|---|---|
| Wednesday, January 1, 2014 | 907246000 | 940778000 |
| Thursday, January 1, 2015 | 944479000 | 939878000 |
| Friday, January 1, 2016 | 1037862000 | 1418151000 |
| Sunday, January 1, 2017 | 1147012000 | 1925713000 |
| Monday, January 1, 2018 | 1205453000 | 2057237000 |
| Tuesday, January 1, 2019 | 1355868000 | 2189922000 |
| Wednesday, January 1, 2020 | 1395382000 | 2169182000 |
| Friday, January 1, 2021 | 1501737000 | 2497287000 |
| Saturday, January 1, 2022 | 1603594000 | 2875847000 |
| Sunday, January 1, 2023 | 2089339000 | 3277438000 |
| Monday, January 1, 2024 | 3727885000 |
Unlocking the unknown
In the ever-evolving landscape of the waste management and construction industries, Waste Connections, Inc. and EMCOR Group, Inc. have emerged as formidable players. Over the past decade, from 2014 to 2023, these companies have demonstrated remarkable growth in gross profit, reflecting their strategic prowess and market adaptability.
Waste Connections, Inc. has seen its gross profit soar by approximately 248%, from around $940 million in 2014 to over $3.28 billion in 2023. This impressive growth underscores the company's ability to capitalize on increasing demand for sustainable waste management solutions. Meanwhile, EMCOR Group, Inc. has also experienced a significant rise, with its gross profit increasing by about 130% during the same period, reaching over $2.08 billion in 2023. This growth highlights EMCOR's successful expansion in the construction and facilities services sector.
These trends not only reflect the companies' individual successes but also signal broader industry shifts towards efficiency and innovation.
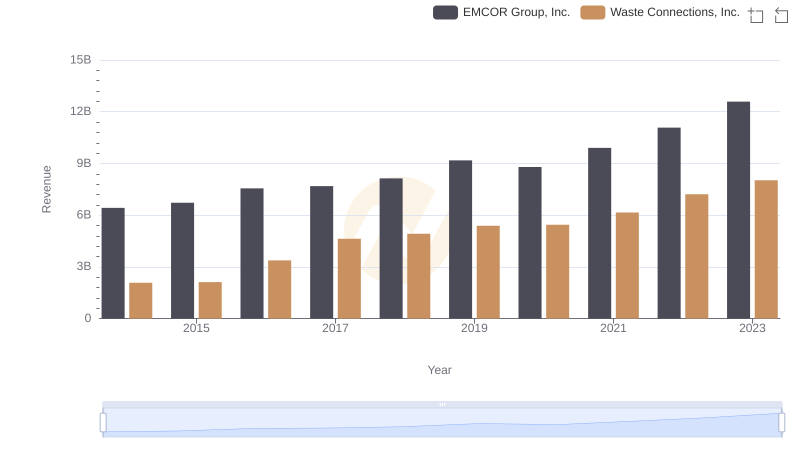
Breaking Down Revenue Trends: Waste Connections, Inc. vs EMCOR Group, Inc.
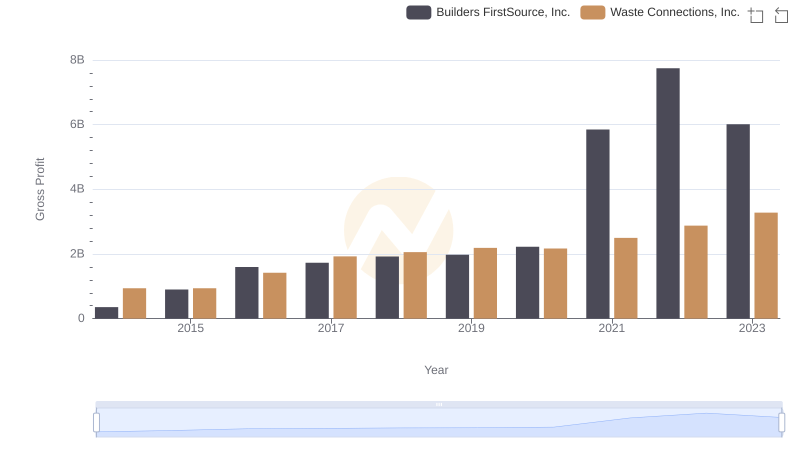
Key Insights on Gross Profit: Waste Connections, Inc. vs Builders FirstSource, Inc.
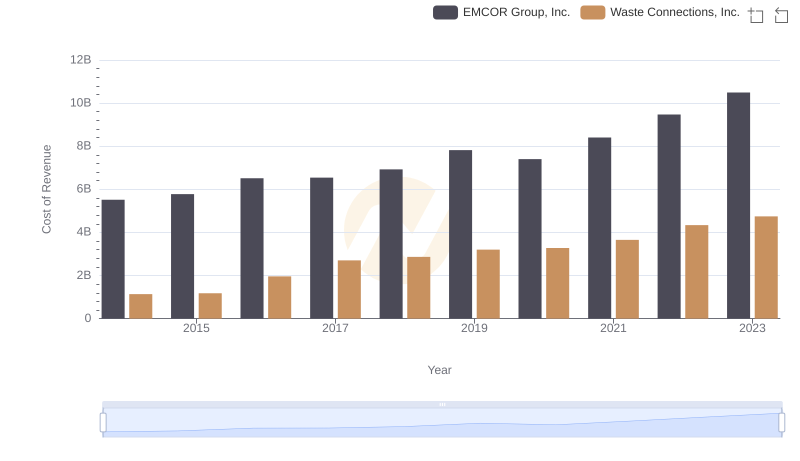
Cost of Revenue Comparison: Waste Connections, Inc. vs EMCOR Group, Inc.
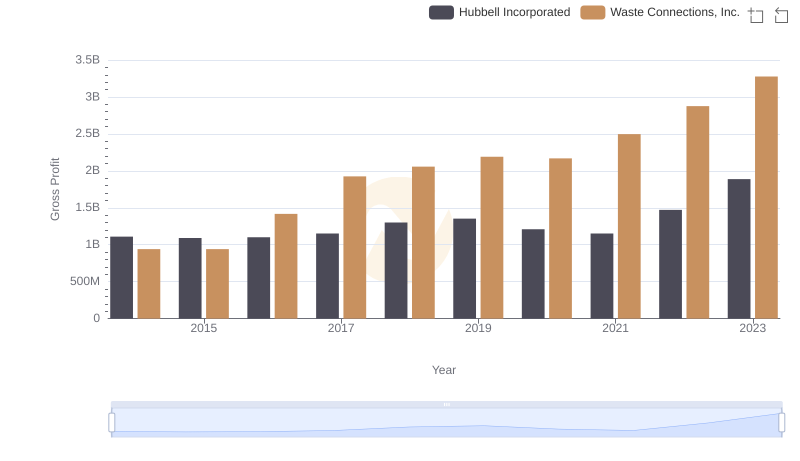
Waste Connections, Inc. and Hubbell Incorporated: A Detailed Gross Profit Analysis
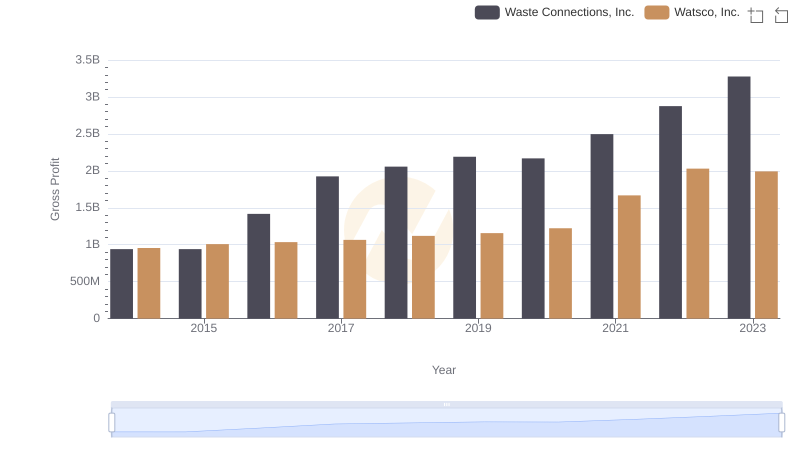
Gross Profit Comparison: Waste Connections, Inc. and Watsco, Inc. Trends
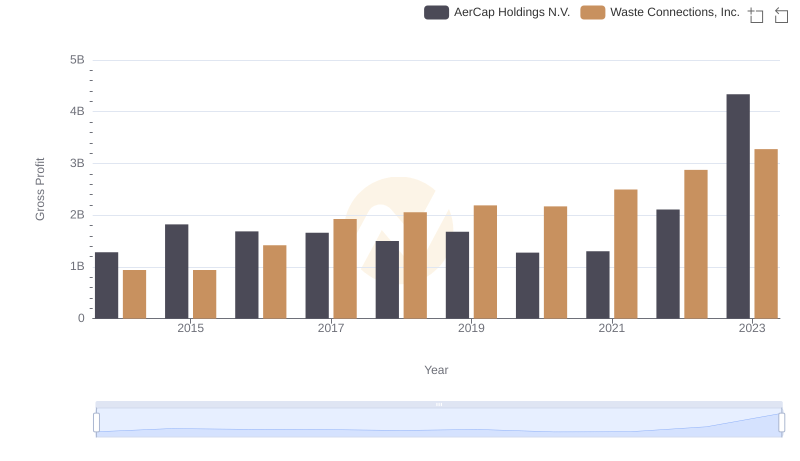
Who Generates Higher Gross Profit? Waste Connections, Inc. or AerCap Holdings N.V.
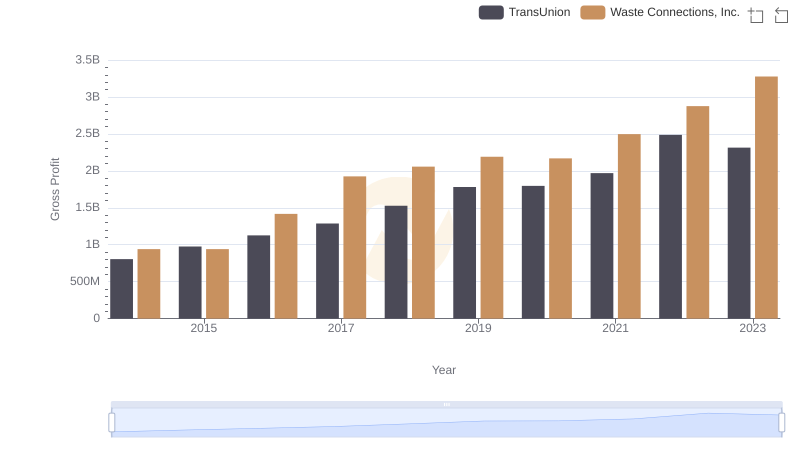
Who Generates Higher Gross Profit? Waste Connections, Inc. or TransUnion

Who Generates Higher Gross Profit? Waste Connections, Inc. or Stanley Black & Decker, Inc.
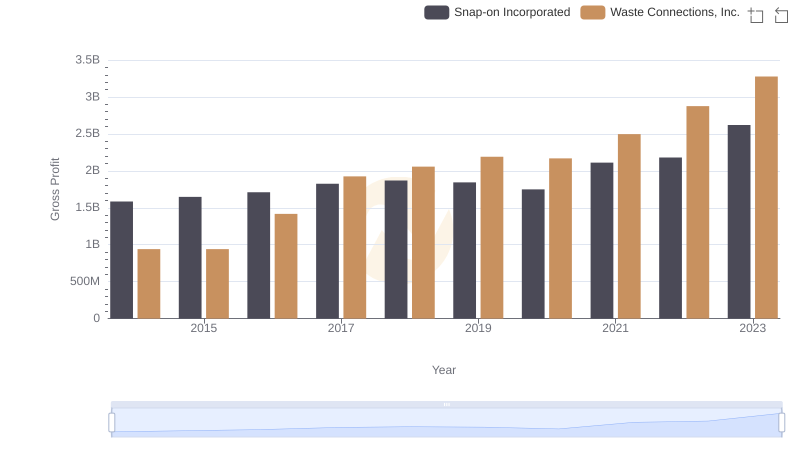
Waste Connections, Inc. vs Snap-on Incorporated: A Gross Profit Performance Breakdown
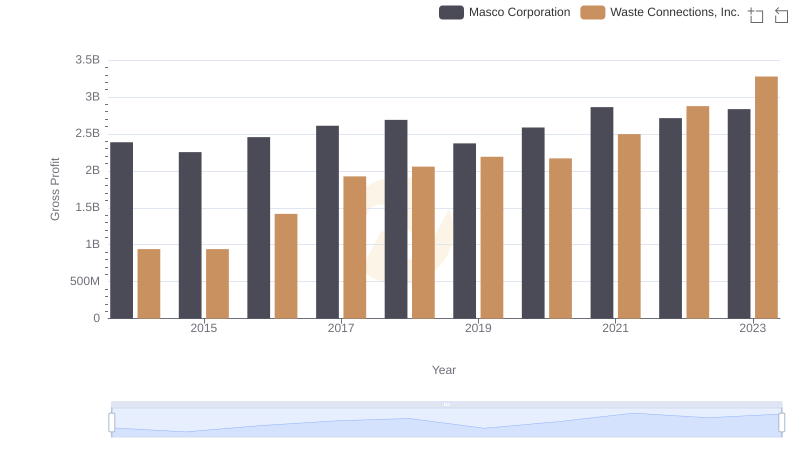
Gross Profit Trends Compared: Waste Connections, Inc. vs Masco Corporation