| __timestamp | EMCOR Group, Inc. | Waste Connections, Inc. |
|---|---|---|
| Wednesday, January 1, 2014 | 6424965000 | 2079166000 |
| Thursday, January 1, 2015 | 6718726000 | 2117287000 |
| Friday, January 1, 2016 | 7551524000 | 3375863000 |
| Sunday, January 1, 2017 | 7686999000 | 4630488000 |
| Monday, January 1, 2018 | 8130631000 | 4922941000 |
| Tuesday, January 1, 2019 | 9174611000 | 5388679000 |
| Wednesday, January 1, 2020 | 8797061000 | 5445990000 |
| Friday, January 1, 2021 | 9903580000 | 6151361000 |
| Saturday, January 1, 2022 | 11076120000 | 7211859000 |
| Sunday, January 1, 2023 | 12582873000 | 8021951000 |
| Monday, January 1, 2024 | 8919591000 |
Unveiling the hidden dimensions of data
In the competitive landscape of the waste management and construction industries, Waste Connections, Inc. and EMCOR Group, Inc. have emerged as formidable players. Over the past decade, these companies have demonstrated remarkable revenue growth, reflecting their strategic prowess and market adaptability.
Since 2014, Waste Connections, Inc. has seen its revenue nearly quadruple, growing from approximately $2.1 billion to over $8 billion by 2023. This impressive growth underscores the company's ability to expand its market share and optimize operations.
Meanwhile, EMCOR Group, Inc. has also experienced significant growth, with revenues increasing by nearly 96% from 2014 to 2023. Starting at around $6.4 billion, EMCOR's revenue surged to approximately $12.6 billion, highlighting its robust performance in the construction and facilities services sector.
Both companies exemplify resilience and strategic growth in their respective industries, setting benchmarks for future performance.
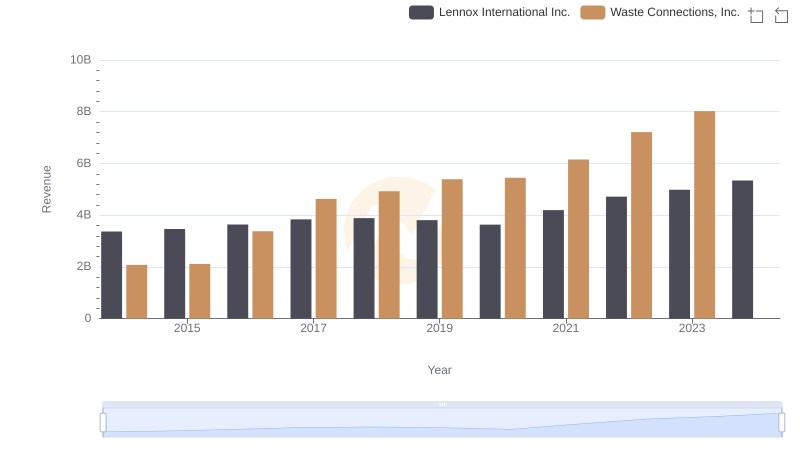
Revenue Insights: Waste Connections, Inc. and Lennox International Inc. Performance Compared
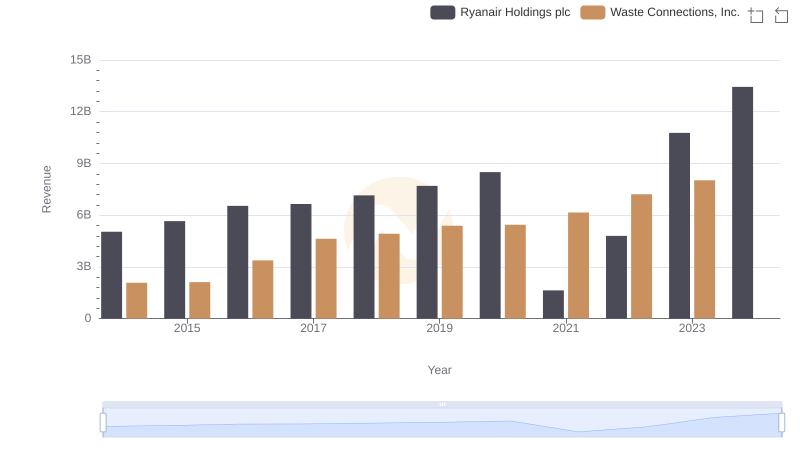
Waste Connections, Inc. vs Ryanair Holdings plc: Examining Key Revenue Metrics
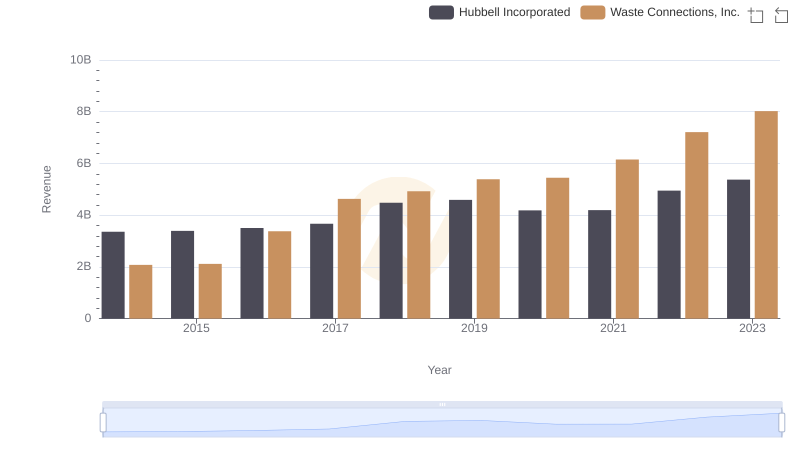
Annual Revenue Comparison: Waste Connections, Inc. vs Hubbell Incorporated
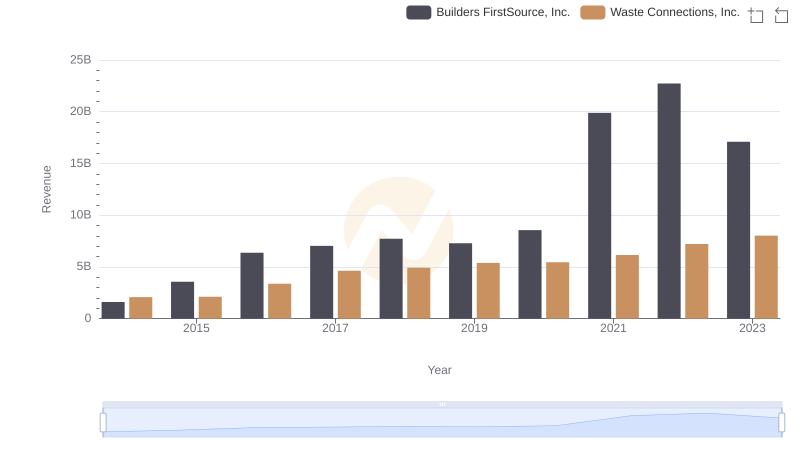
Who Generates More Revenue? Waste Connections, Inc. or Builders FirstSource, Inc.
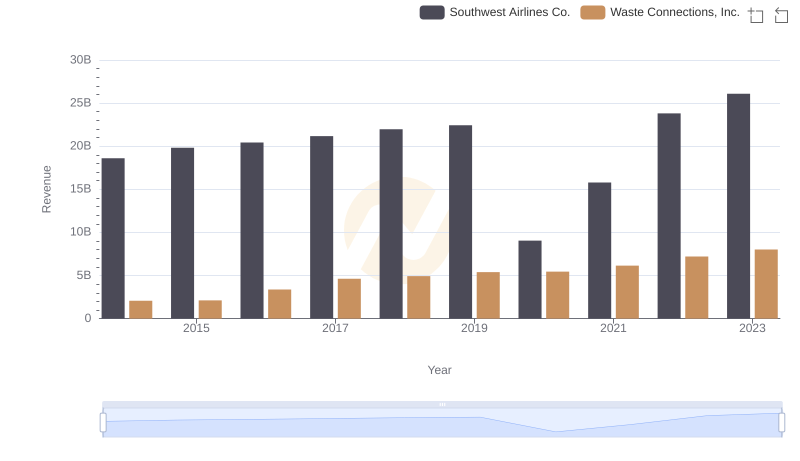
Annual Revenue Comparison: Waste Connections, Inc. vs Southwest Airlines Co.
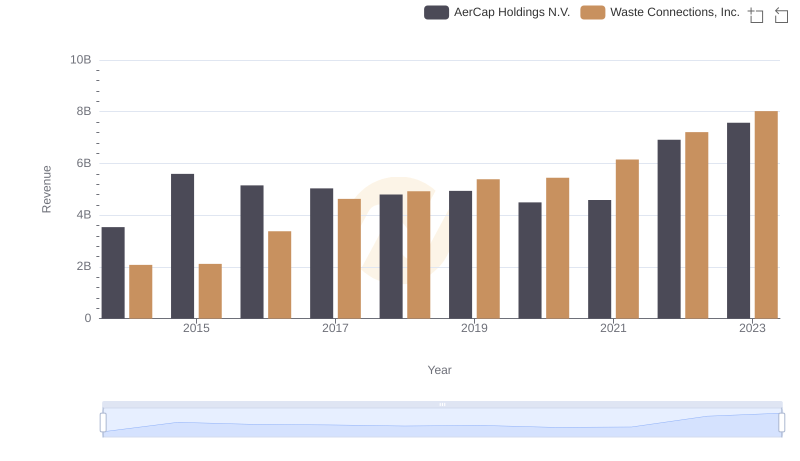
Revenue Showdown: Waste Connections, Inc. vs AerCap Holdings N.V.
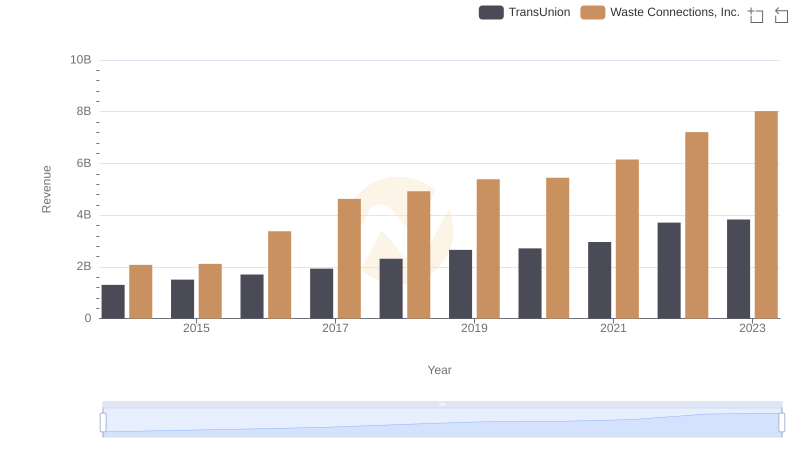
Comparing Revenue Performance: Waste Connections, Inc. or TransUnion?
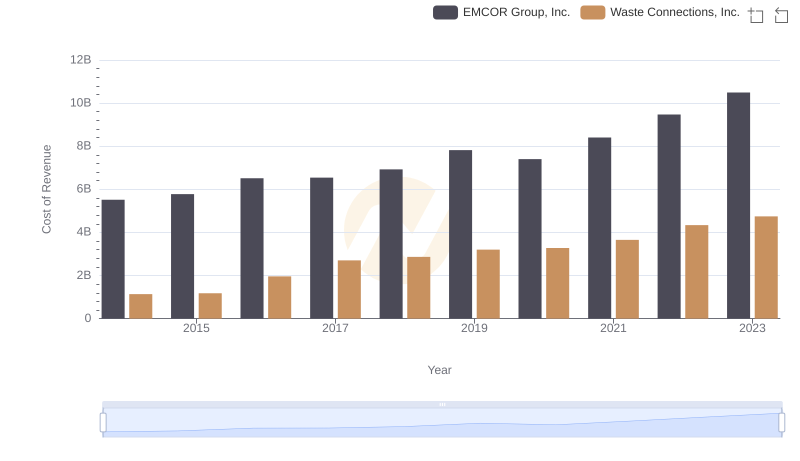
Cost of Revenue Comparison: Waste Connections, Inc. vs EMCOR Group, Inc.
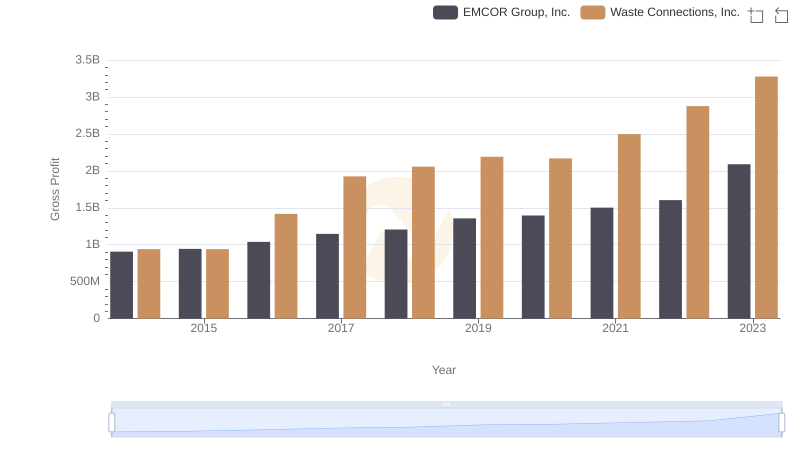
Gross Profit Trends Compared: Waste Connections, Inc. vs EMCOR Group, Inc.