| __timestamp | Stanley Black & Decker, Inc. | The Boeing Company |
|---|---|---|
| Wednesday, January 1, 2014 | 7235900000 | 76752000000 |
| Thursday, January 1, 2015 | 7099800000 | 82088000000 |
| Friday, January 1, 2016 | 7139700000 | 80790000000 |
| Sunday, January 1, 2017 | 7969200000 | 76066000000 |
| Monday, January 1, 2018 | 9080500000 | 81490000000 |
| Tuesday, January 1, 2019 | 9636700000 | 72093000000 |
| Wednesday, January 1, 2020 | 9566700000 | 63843000000 |
| Friday, January 1, 2021 | 10423000000 | 59237000000 |
| Saturday, January 1, 2022 | 12663300000 | 63078000000 |
| Sunday, January 1, 2023 | 11683100000 | 70070000000 |
| Monday, January 1, 2024 | 10851300000 | 68508000000 |
Unveiling the hidden dimensions of data
In the ever-evolving landscape of American industry, two titans stand out: The Boeing Company and Stanley Black & Decker, Inc. Over the past decade, these companies have showcased contrasting trends in cost of revenue efficiency. Boeing, a leader in aerospace, saw its cost of revenue peak in 2015, with a gradual decline of approximately 15% by 2023. This reflects the challenges faced by the aviation sector, including global disruptions and shifting market demands.
Conversely, Stanley Black & Decker, a stalwart in the tools and storage industry, demonstrated a robust growth trajectory. From 2014 to 2023, their cost of revenue surged by nearly 60%, highlighting their strategic expansions and market resilience. This divergence underscores the dynamic nature of industry-specific challenges and opportunities, offering a fascinating glimpse into the financial strategies of these iconic American companies.
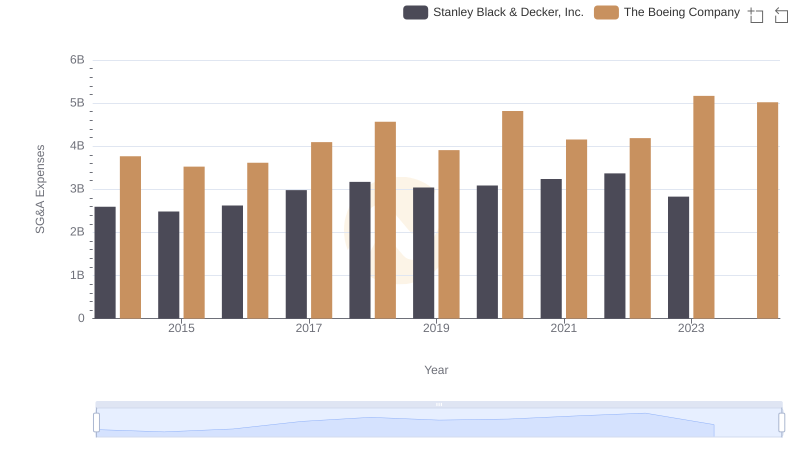
Selling, General, and Administrative Costs: The Boeing Company vs Stanley Black & Decker, Inc.
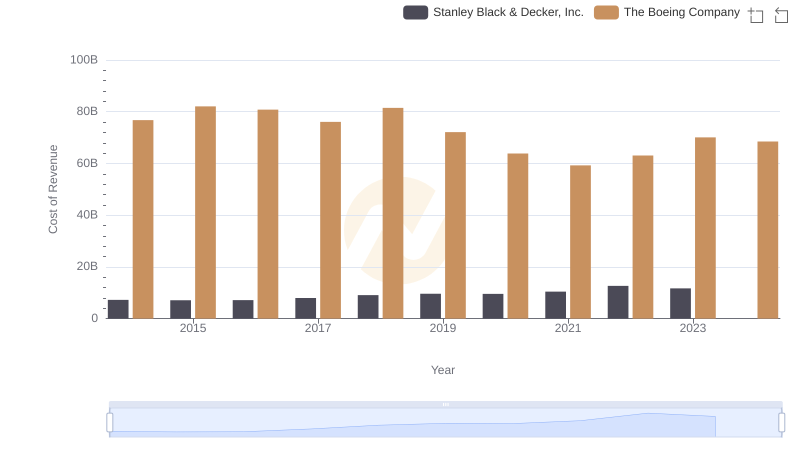
Cost of Revenue Comparison: The Boeing Company vs Stanley Black & Decker, Inc.
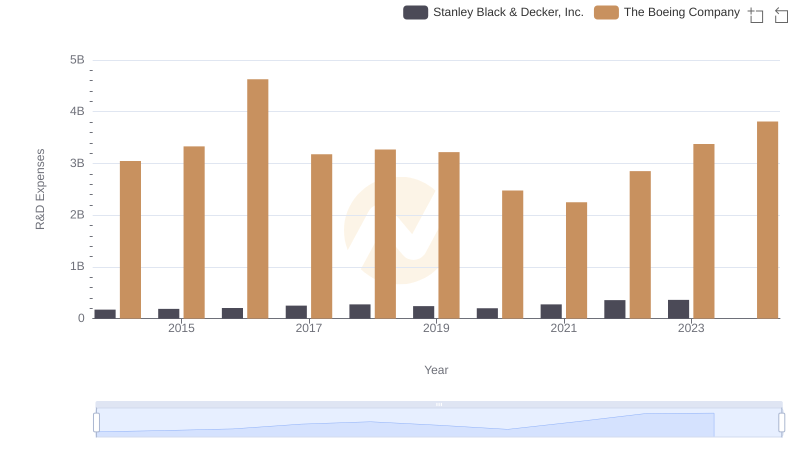
R&D Spending Showdown: The Boeing Company vs Stanley Black & Decker, Inc.

The Boeing Company or Stanley Black & Decker, Inc.: Who Manages SG&A Costs Better?