| __timestamp | QUALCOMM Incorporated | Super Micro Computer, Inc. |
|---|---|---|
| Wednesday, January 1, 2014 | 10686000000 | 1241657000 |
| Thursday, January 1, 2015 | 10378000000 | 1670924000 |
| Friday, January 1, 2016 | 9749000000 | 1884048000 |
| Sunday, January 1, 2017 | 9792000000 | 2171349000 |
| Monday, January 1, 2018 | 10244000000 | 2930498000 |
| Tuesday, January 1, 2019 | 8599000000 | 3004838000 |
| Wednesday, January 1, 2020 | 9255000000 | 2813071000 |
| Friday, January 1, 2021 | 14262000000 | 3022884000 |
| Saturday, January 1, 2022 | 18635000000 | 4396098000 |
| Sunday, January 1, 2023 | 15869000000 | 5840470000 |
| Monday, January 1, 2024 | 17060000000 | 12831125000 |
Cracking the code
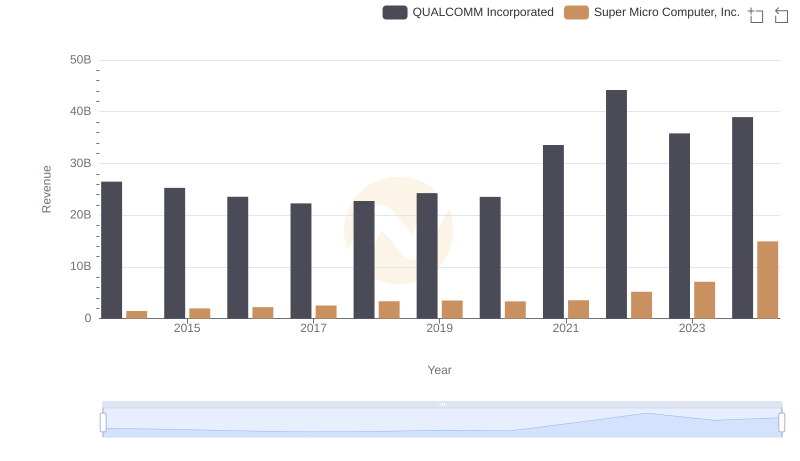
In the ever-evolving tech industry, understanding cost structures is crucial for investors and analysts. This chart provides a decade-long insight into the cost of revenue for two tech giants: QUALCOMM Incorporated and Super Micro Computer, Inc., from 2014 to 2024.
QUALCOMM, a leader in wireless technology, has seen its cost of revenue fluctuate over the years. Starting at approximately $10.7 billion in 2014, it peaked at around $18.6 billion in 2022, marking a 74% increase. This trend reflects QUALCOMM's strategic investments in R&D and market expansion.
Super Micro Computer, known for its high-performance computing solutions, has experienced a dramatic rise in its cost of revenue. From a modest $1.2 billion in 2014, it surged to $12.8 billion in 2024, a tenfold increase. This growth underscores the company's aggressive market penetration and scaling efforts.
Both companies exhibit unique growth trajectories, highlighting their distinct market strategies and operational efficiencies.
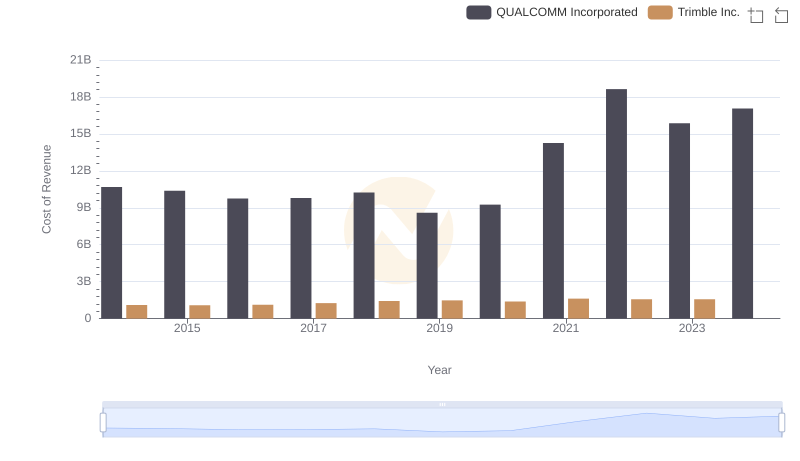
Comparing Cost of Revenue Efficiency: QUALCOMM Incorporated vs Trimble Inc.
Revenue Insights: QUALCOMM Incorporated and Super Micro Computer, Inc. Performance Compared
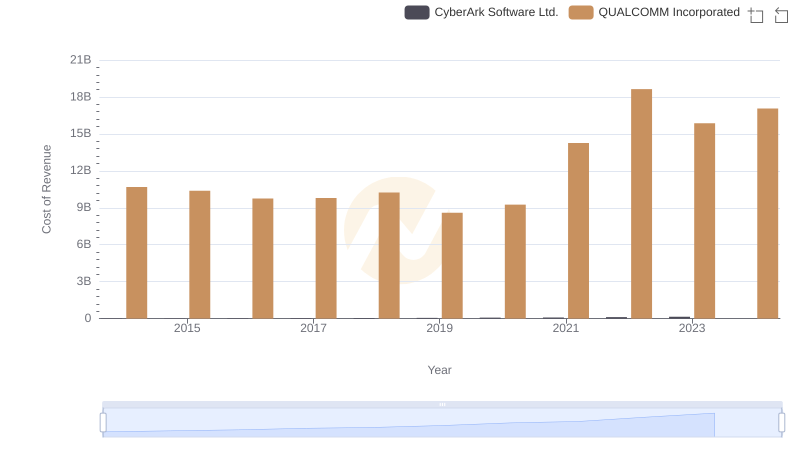
Cost of Revenue: Key Insights for QUALCOMM Incorporated and CyberArk Software Ltd.
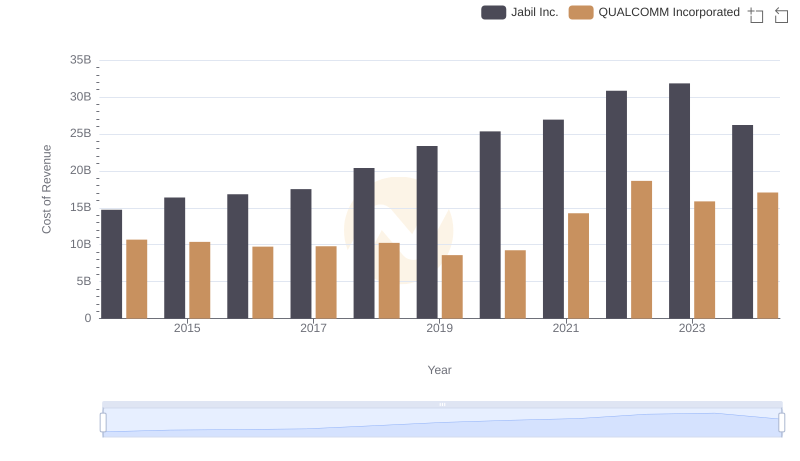
Cost of Revenue Comparison: QUALCOMM Incorporated vs Jabil Inc.

Cost Insights: Breaking Down QUALCOMM Incorporated and Manhattan Associates, Inc.'s Expenses
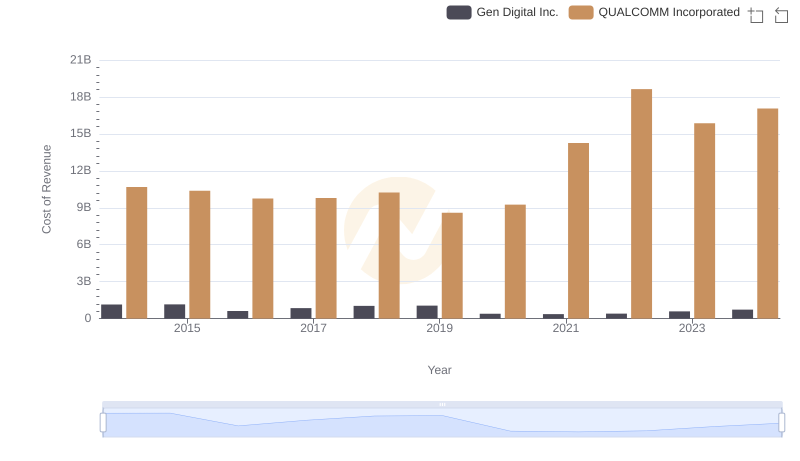
Cost of Revenue Comparison: QUALCOMM Incorporated vs Gen Digital Inc.
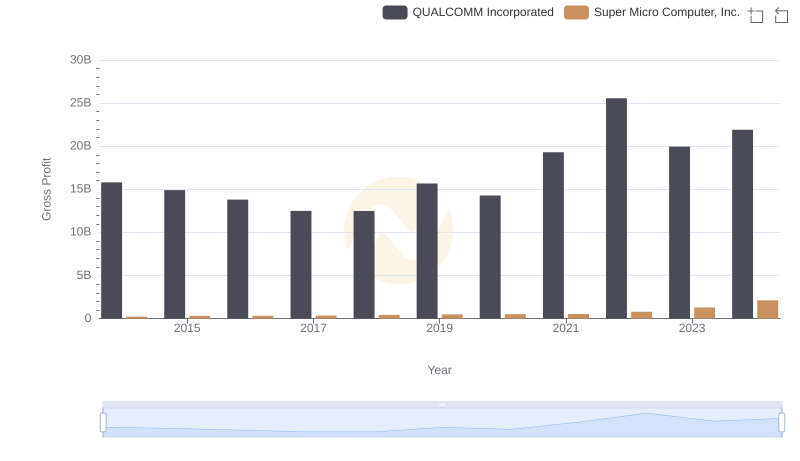
Gross Profit Trends Compared: QUALCOMM Incorporated vs Super Micro Computer, Inc.
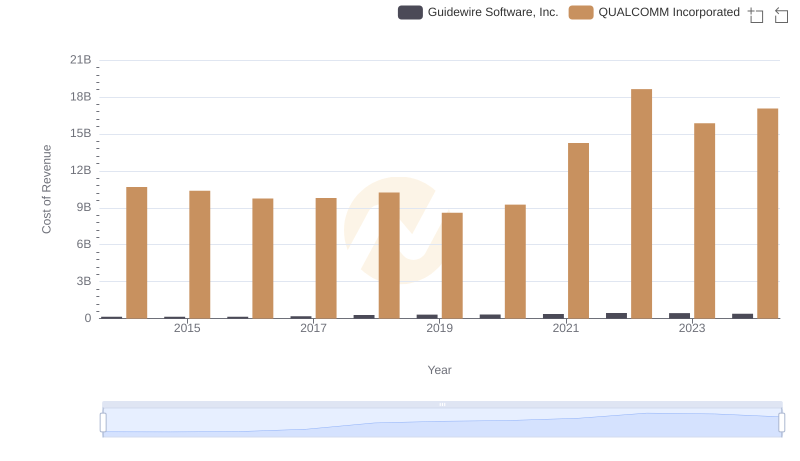
Cost of Revenue Trends: QUALCOMM Incorporated vs Guidewire Software, Inc.
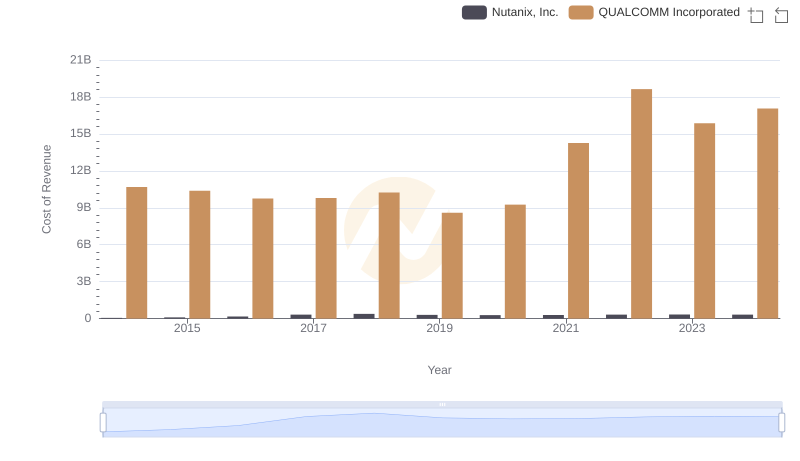
Cost of Revenue Comparison: QUALCOMM Incorporated vs Nutanix, Inc.
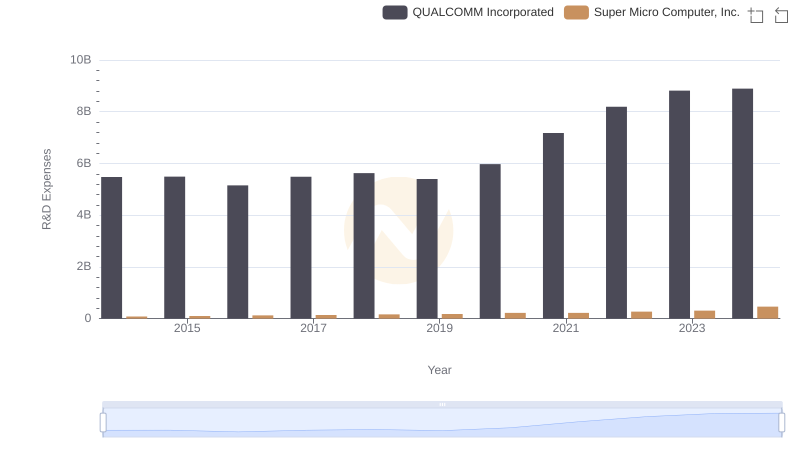
QUALCOMM Incorporated vs Super Micro Computer, Inc.: Strategic Focus on R&D Spending
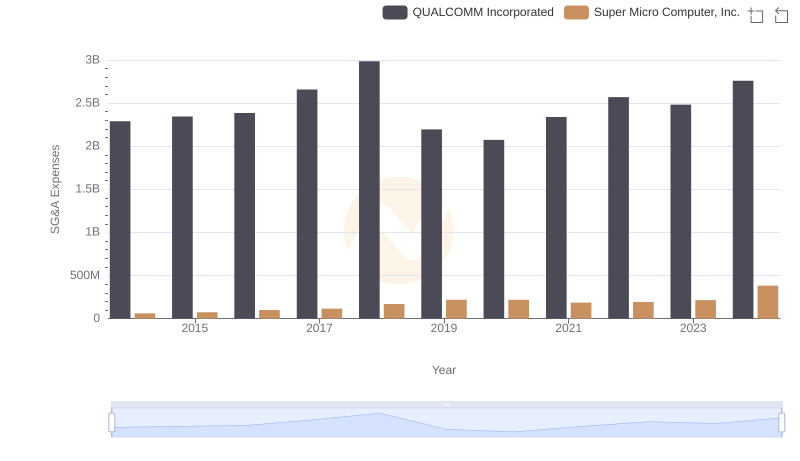
QUALCOMM Incorporated and Super Micro Computer, Inc.: SG&A Spending Patterns Compared
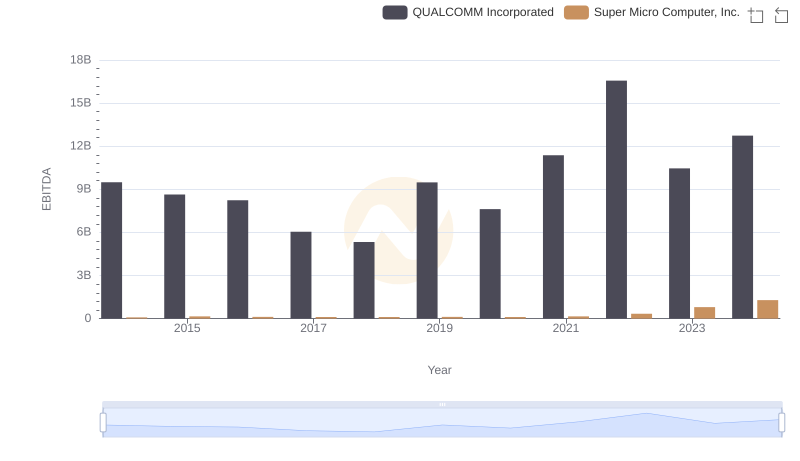
Comparative EBITDA Analysis: QUALCOMM Incorporated vs Super Micro Computer, Inc.