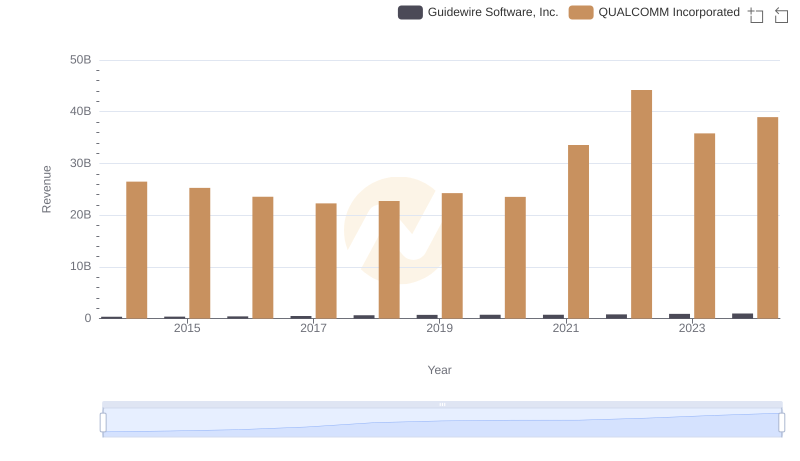
| __timestamp | Guidewire Software, Inc. | QUALCOMM Incorporated |
|---|---|---|
| Wednesday, January 1, 2014 | 148947000 | 10686000000 |
| Thursday, January 1, 2015 | 147184000 | 10378000000 |
| Friday, January 1, 2016 | 151834000 | 9749000000 |
| Sunday, January 1, 2017 | 191559000 | 9792000000 |
| Monday, January 1, 2018 | 296707000 | 10244000000 |
| Tuesday, January 1, 2019 | 324350000 | 8599000000 |
| Wednesday, January 1, 2020 | 338015000 | 9255000000 |
| Friday, January 1, 2021 | 375054000 | 14262000000 |
| Saturday, January 1, 2022 | 460394000 | 18635000000 |
| Sunday, January 1, 2023 | 447130000 | 15869000000 |
| Monday, January 1, 2024 | 397136000 | 17060000000 |
Unveiling the hidden dimensions of data
In the ever-evolving tech landscape, understanding cost dynamics is crucial. This chart offers a fascinating glimpse into the cost of revenue trends for two industry leaders: QUALCOMM Incorporated and Guidewire Software, Inc., from 2014 to 2024. Over this decade, QUALCOMM's cost of revenue has shown significant fluctuations, peaking in 2022 with a 75% increase from its 2019 low. Meanwhile, Guidewire Software has experienced a steady rise, with a notable 210% growth from 2014 to 2022.
QUALCOMM, a titan in wireless technology, saw its cost of revenue dip in 2019, only to surge by 117% by 2023. This reflects its strategic investments in 5G and IoT technologies.
Guidewire, a leader in insurance software, has maintained a consistent upward trajectory, with a 200% increase in cost of revenue from 2014 to 2023, underscoring its expanding market footprint.
These trends highlight the contrasting strategies of these tech giants, offering valuable insights for investors and industry analysts alike.
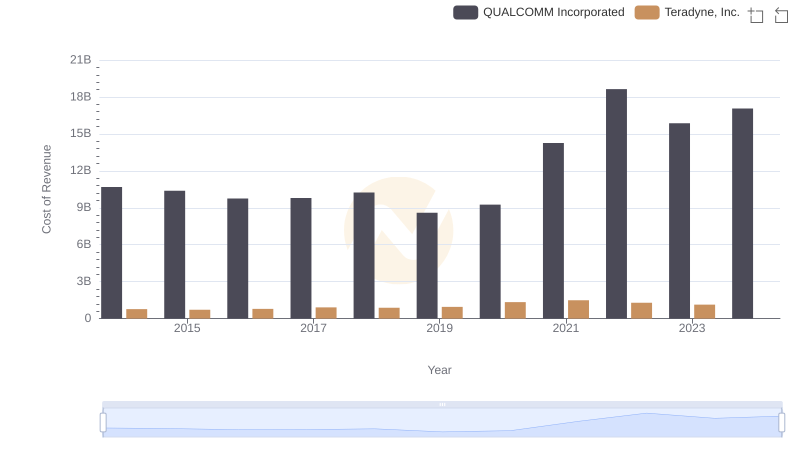
Cost Insights: Breaking Down QUALCOMM Incorporated and Teradyne, Inc.'s Expenses
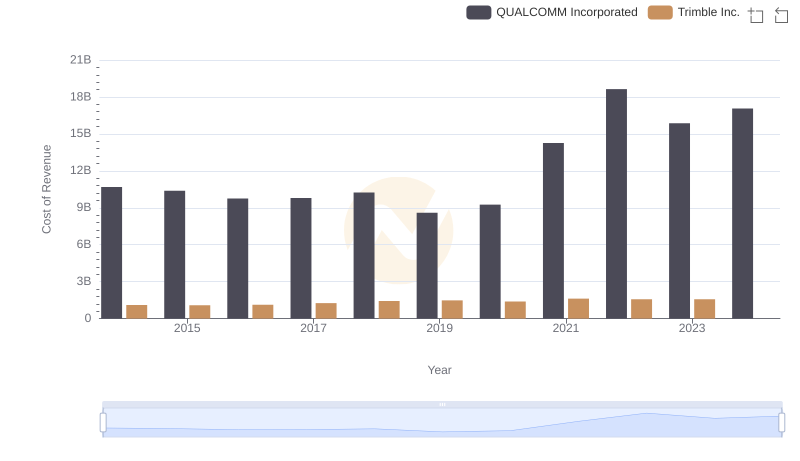
Comparing Cost of Revenue Efficiency: QUALCOMM Incorporated vs Trimble Inc.
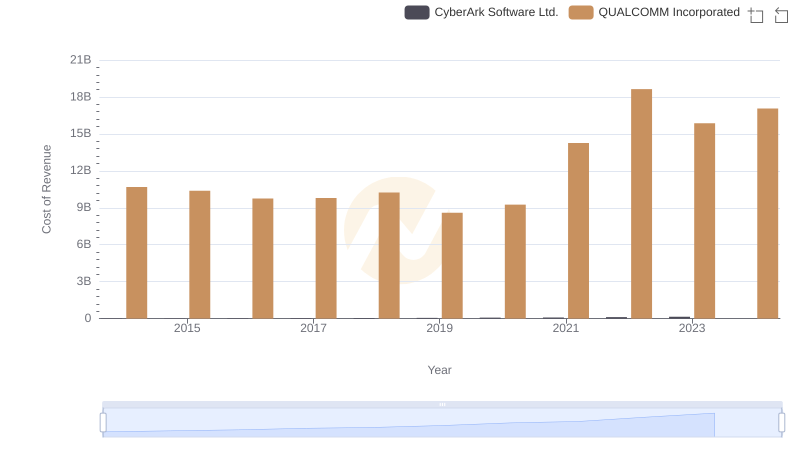
Cost of Revenue: Key Insights for QUALCOMM Incorporated and CyberArk Software Ltd.
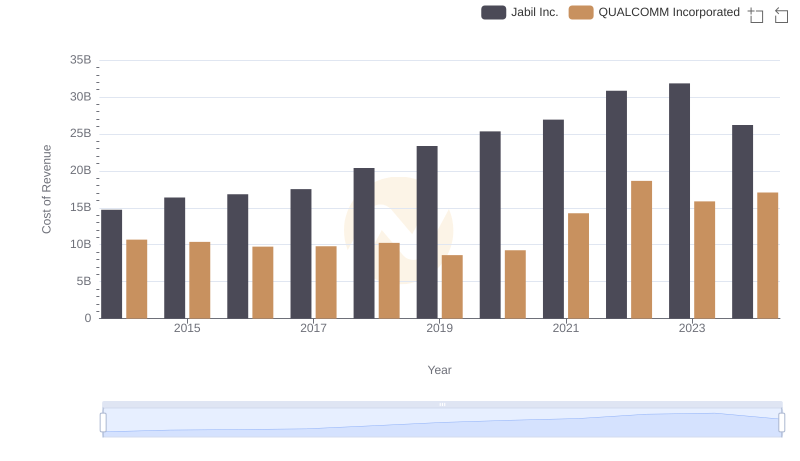
Cost of Revenue Comparison: QUALCOMM Incorporated vs Jabil Inc.
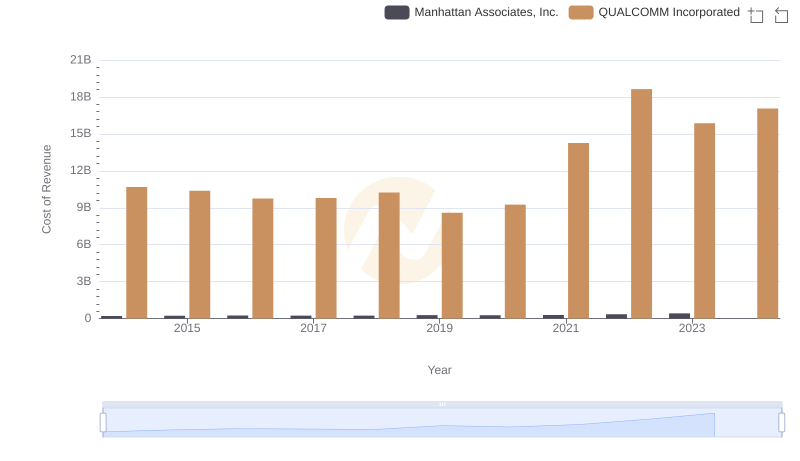
Cost Insights: Breaking Down QUALCOMM Incorporated and Manhattan Associates, Inc.'s Expenses
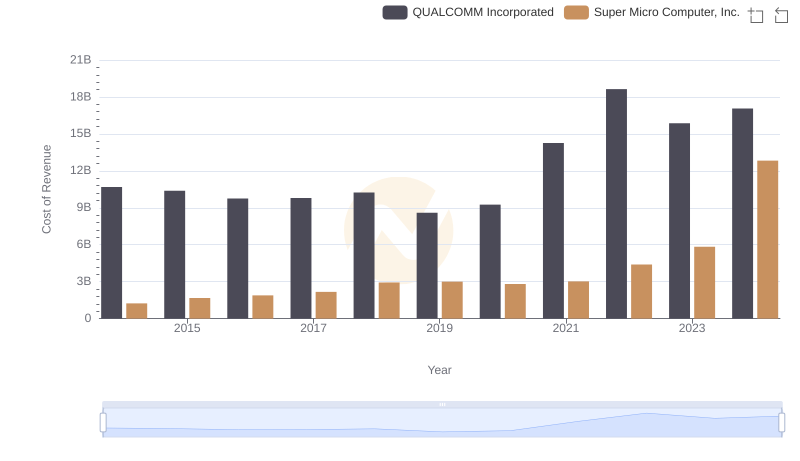
Cost of Revenue: Key Insights for QUALCOMM Incorporated and Super Micro Computer, Inc.
Comparing Revenue Performance: QUALCOMM Incorporated or Guidewire Software, Inc.?
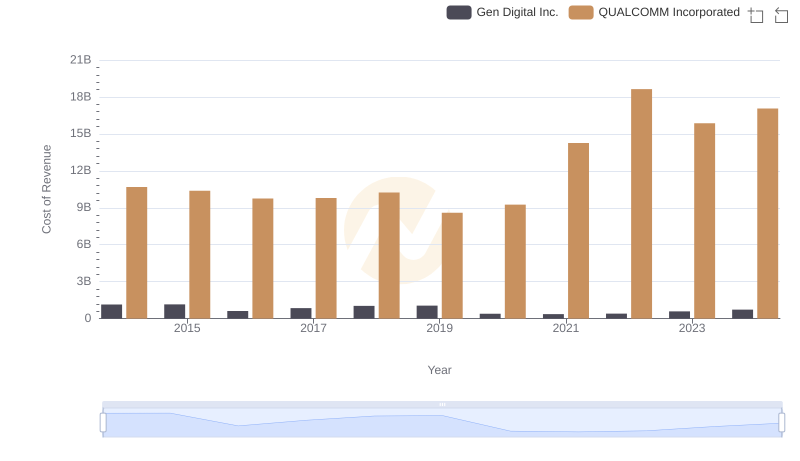
Cost of Revenue Comparison: QUALCOMM Incorporated vs Gen Digital Inc.
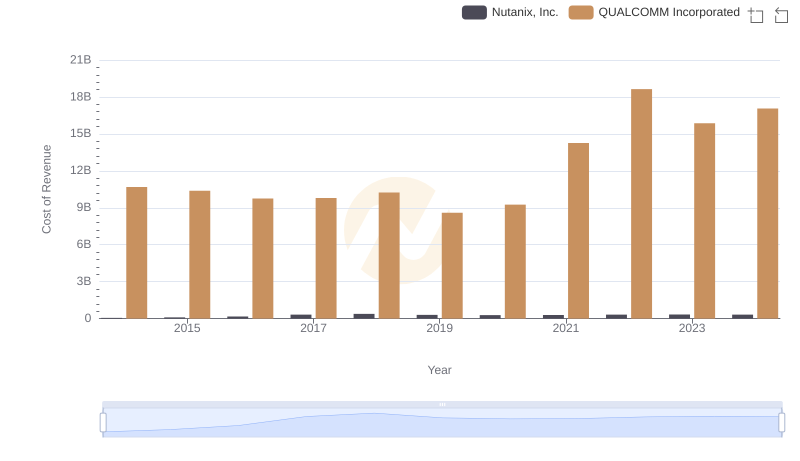
Cost of Revenue Comparison: QUALCOMM Incorporated vs Nutanix, Inc.
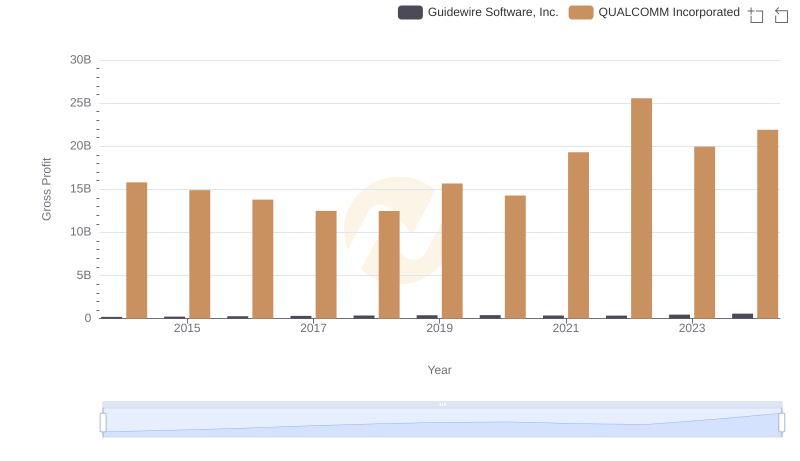
QUALCOMM Incorporated vs Guidewire Software, Inc.: A Gross Profit Performance Breakdown
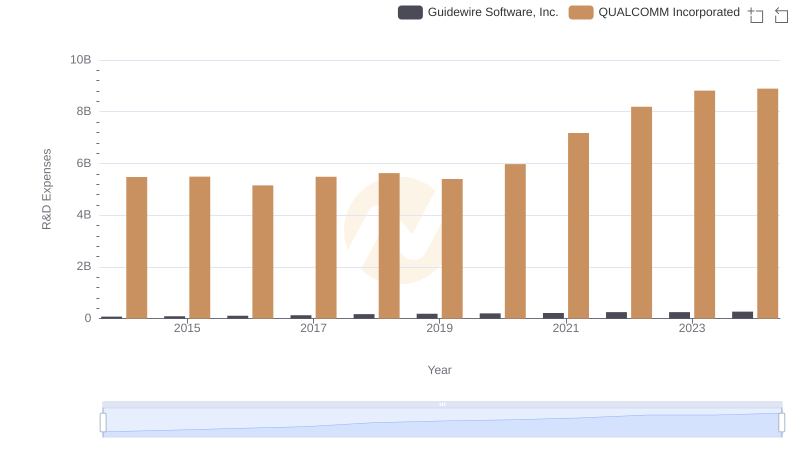
R&D Spending Showdown: QUALCOMM Incorporated vs Guidewire Software, Inc.
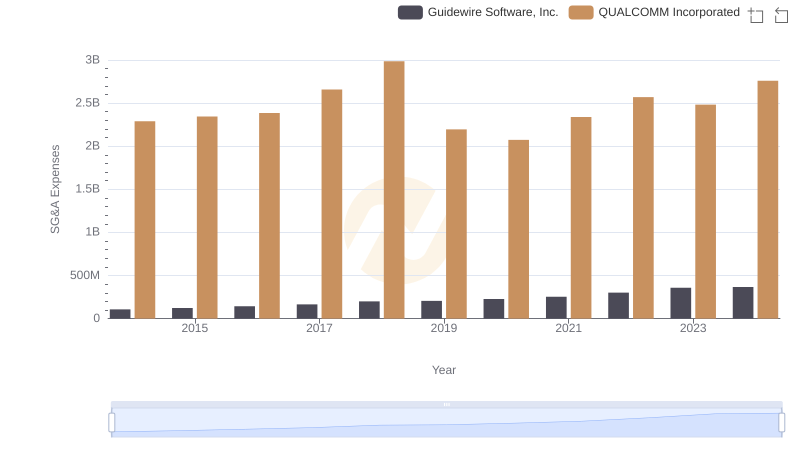
QUALCOMM Incorporated or Guidewire Software, Inc.: Who Manages SG&A Costs Better?