| __timestamp | Parker-Hannifin Corporation | XPO Logistics, Inc. |
|---|---|---|
| Wednesday, January 1, 2014 | 1633992000 | 422500000 |
| Thursday, January 1, 2015 | 1544746000 | 1113400000 |
| Friday, January 1, 2016 | 1359360000 | 1651200000 |
| Sunday, January 1, 2017 | 1453935000 | 1656500000 |
| Monday, January 1, 2018 | 1657152000 | 1837000000 |
| Tuesday, January 1, 2019 | 1543939000 | 1845000000 |
| Wednesday, January 1, 2020 | 1656553000 | 2172000000 |
| Friday, January 1, 2021 | 1527302000 | 1322000000 |
| Saturday, January 1, 2022 | 1627116000 | 678000000 |
| Sunday, January 1, 2023 | 3354103000 | 167000000 |
| Monday, January 1, 2024 | 3315177000 | 134000000 |
Cracking the code
In the ever-evolving landscape of industrial and logistics sectors, understanding the financial health of key players is crucial. Parker-Hannifin Corporation and XPO Logistics, Inc. have shown distinct trends in their Selling, General, and Administrative (SG&A) expenses over the past decade. From 2014 to 2023, Parker-Hannifin's SG&A expenses have seen a significant increase, peaking in 2023 with a staggering 105% rise compared to 2014. This surge reflects strategic investments and potential expansions. In contrast, XPO Logistics experienced a peak in 2020, with expenses nearly quadrupling from 2014, before a sharp decline in subsequent years. This fluctuation may indicate restructuring or efficiency improvements. Notably, data for 2024 is incomplete, highlighting the dynamic nature of financial forecasting. These trends offer a window into the strategic priorities and operational efficiencies of these industry giants.

Parker-Hannifin Corporation and XPO Logistics, Inc.: A Comprehensive Revenue Analysis
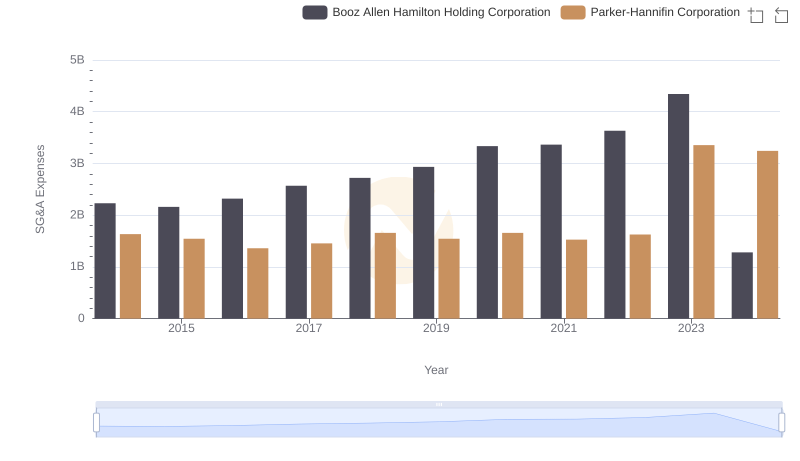
Breaking Down SG&A Expenses: Parker-Hannifin Corporation vs Booz Allen Hamilton Holding Corporation
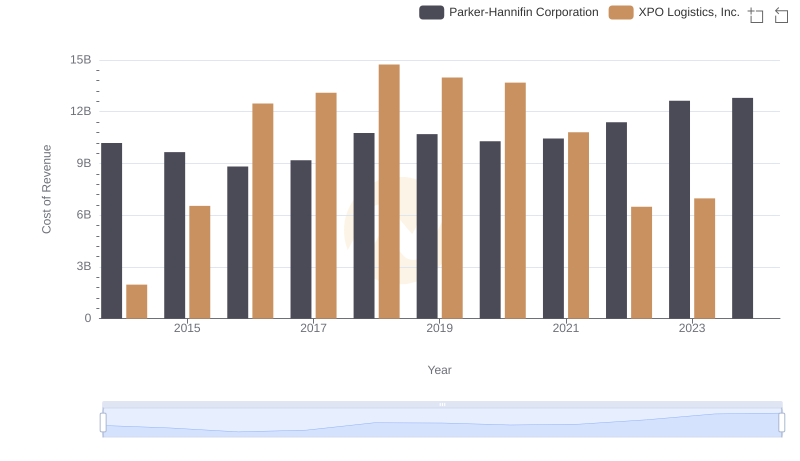
Cost of Revenue Comparison: Parker-Hannifin Corporation vs XPO Logistics, Inc.
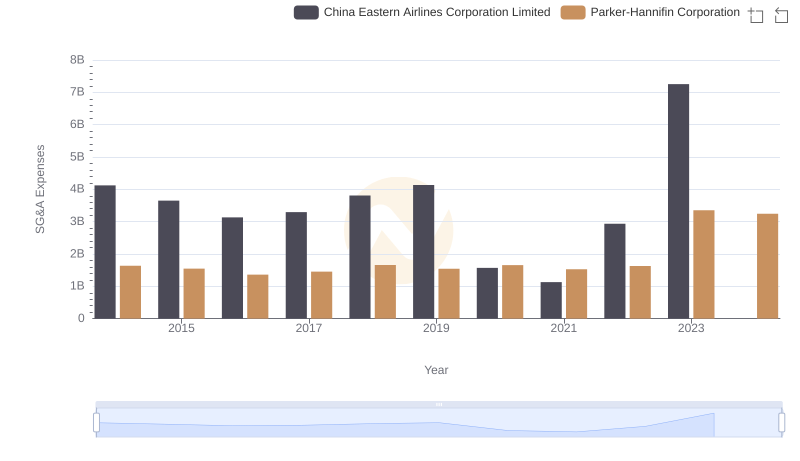
Parker-Hannifin Corporation vs China Eastern Airlines Corporation Limited: SG&A Expense Trends
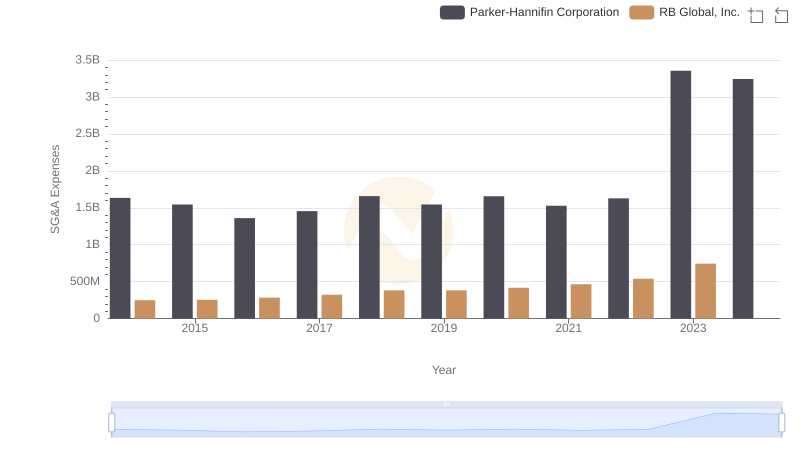
Breaking Down SG&A Expenses: Parker-Hannifin Corporation vs RB Global, Inc.
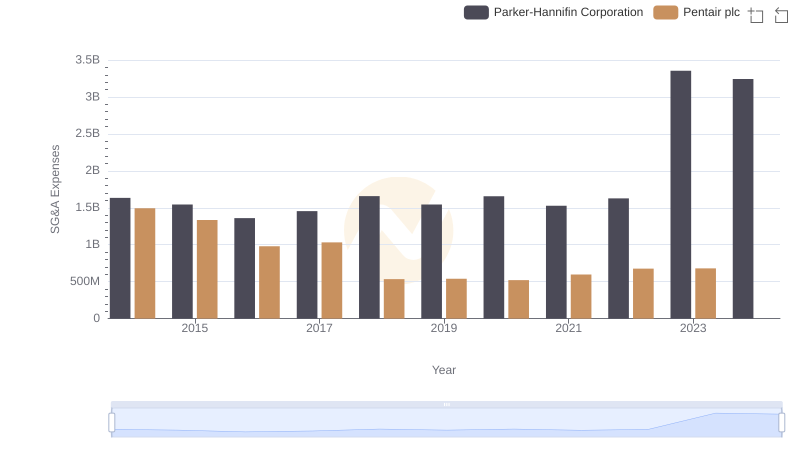
Who Optimizes SG&A Costs Better? Parker-Hannifin Corporation or Pentair plc
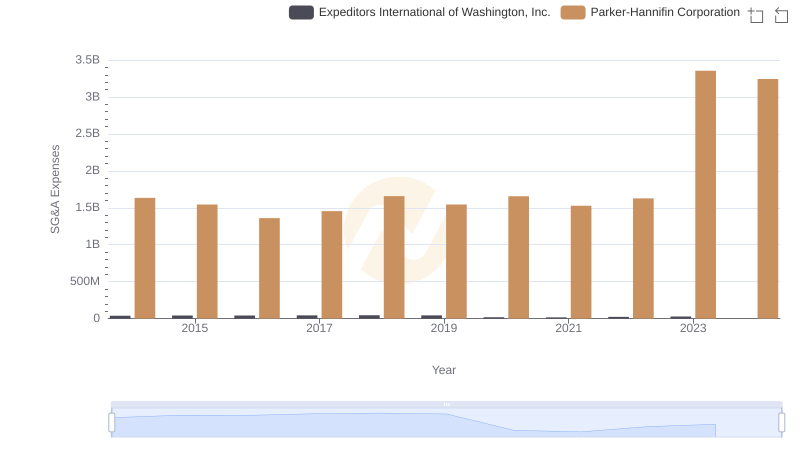
Who Optimizes SG&A Costs Better? Parker-Hannifin Corporation or Expeditors International of Washington, Inc.