| __timestamp | Parker-Hannifin Corporation | XPO Logistics, Inc. |
|---|---|---|
| Wednesday, January 1, 2014 | 13215971000 | 2356600000 |
| Thursday, January 1, 2015 | 12711744000 | 7623200000 |
| Friday, January 1, 2016 | 11360753000 | 14619400000 |
| Sunday, January 1, 2017 | 12029312000 | 15380800000 |
| Monday, January 1, 2018 | 14302392000 | 17279000000 |
| Tuesday, January 1, 2019 | 14320324000 | 16648000000 |
| Wednesday, January 1, 2020 | 13695520000 | 16252000000 |
| Friday, January 1, 2021 | 14347640000 | 12806000000 |
| Saturday, January 1, 2022 | 15861608000 | 7718000000 |
| Sunday, January 1, 2023 | 19065194000 | 7744000000 |
| Monday, January 1, 2024 | 19929606000 | 8072000000 |
Data in motion
In the ever-evolving landscape of industrial and logistics sectors, Parker-Hannifin Corporation and XPO Logistics, Inc. have showcased intriguing revenue trajectories over the past decade. From 2014 to 2023, Parker-Hannifin's revenue surged by approximately 51%, peaking in 2023. This growth reflects the company's robust adaptation to market demands and technological advancements. In contrast, XPO Logistics experienced a dramatic rise until 2019, with a 608% increase from 2014, before witnessing a decline post-2020. This shift highlights the volatility and challenges within the logistics industry, possibly due to global disruptions and strategic realignments. Notably, data for 2024 is incomplete, indicating potential shifts or strategic pivots. As these giants navigate the future, stakeholders must keenly observe their strategies to maintain competitive edges in their respective domains.
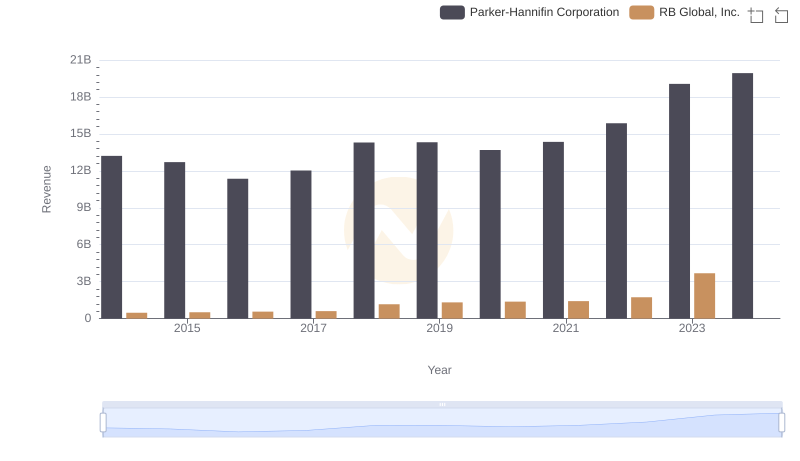
Breaking Down Revenue Trends: Parker-Hannifin Corporation vs RB Global, Inc.
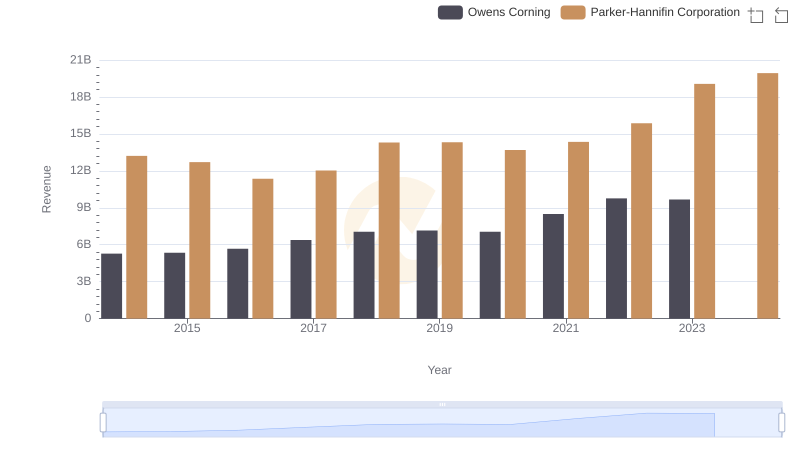
Comparing Revenue Performance: Parker-Hannifin Corporation or Owens Corning?

Revenue Insights: Parker-Hannifin Corporation and Expeditors International of Washington, Inc. Performance Compared

Parker-Hannifin Corporation or China Eastern Airlines Corporation Limited: Who Leads in Yearly Revenue?
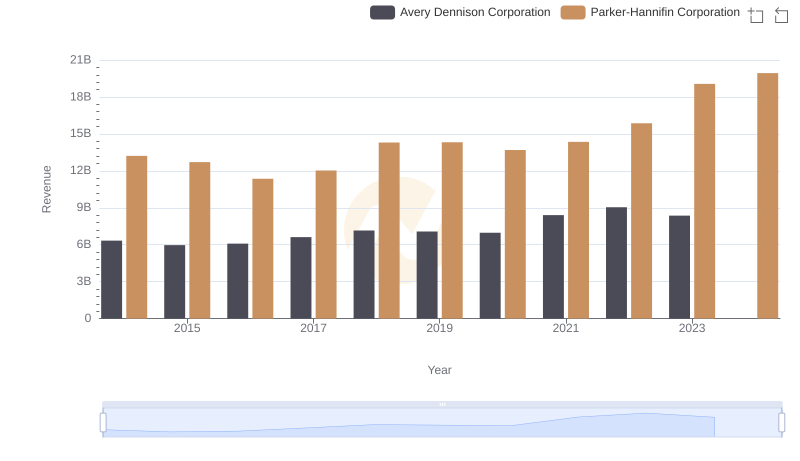
Comparing Revenue Performance: Parker-Hannifin Corporation or Avery Dennison Corporation?
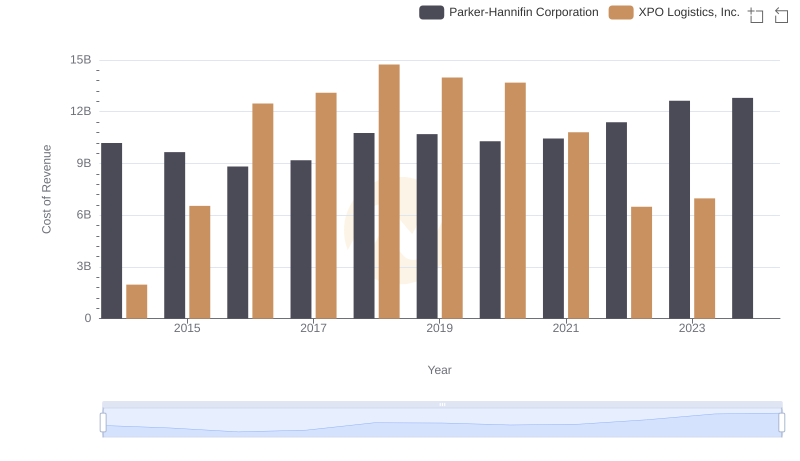
Cost of Revenue Comparison: Parker-Hannifin Corporation vs XPO Logistics, Inc.

Revenue Insights: Parker-Hannifin Corporation and ZTO Express (Cayman) Inc. Performance Compared
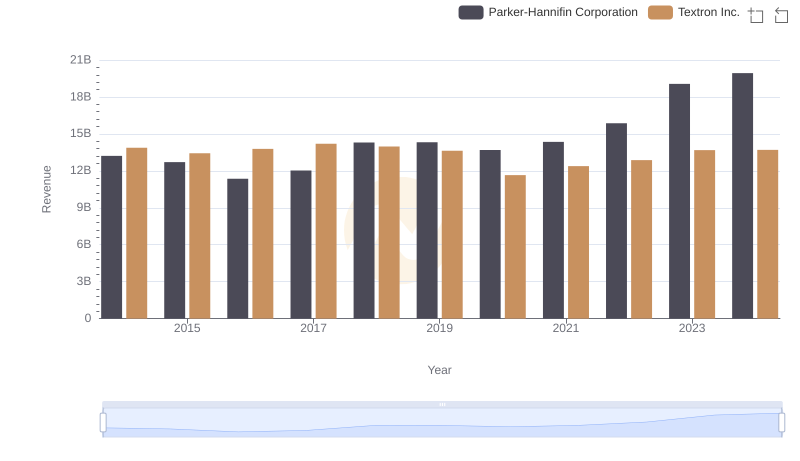
Who Generates More Revenue? Parker-Hannifin Corporation or Textron Inc.
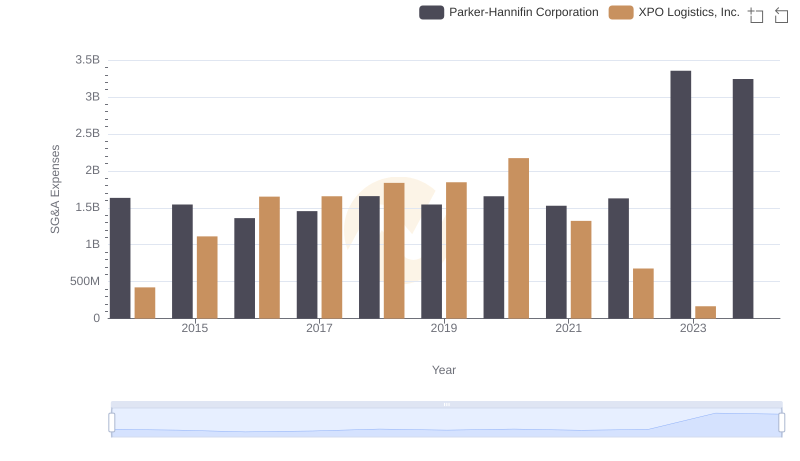
Parker-Hannifin Corporation vs XPO Logistics, Inc.: SG&A Expense Trends