| __timestamp | Allegion plc | Parker-Hannifin Corporation |
|---|---|---|
| Wednesday, January 1, 2014 | 853700000 | 3027744000 |
| Thursday, January 1, 2015 | 869100000 | 3056499000 |
| Friday, January 1, 2016 | 985300000 | 2537369000 |
| Sunday, January 1, 2017 | 1070700000 | 2840350000 |
| Monday, January 1, 2018 | 1173300000 | 3539551000 |
| Tuesday, January 1, 2019 | 1252300000 | 3616840000 |
| Wednesday, January 1, 2020 | 1178800000 | 3409002000 |
| Friday, January 1, 2021 | 1204900000 | 3897960000 |
| Saturday, January 1, 2022 | 1322400000 | 4474341000 |
| Sunday, January 1, 2023 | 1581500000 | 6429302000 |
| Monday, January 1, 2024 | 1668500000 | 7127790000 |
Infusing magic into the data realm
In the competitive landscape of industrial manufacturing, Parker-Hannifin Corporation and Allegion plc stand as titans. Over the past decade, Parker-Hannifin has consistently outperformed Allegion in terms of gross profit. From 2014 to 2023, Parker-Hannifin's gross profit surged by over 110%, peaking at approximately $6.43 billion in 2023. In contrast, Allegion's growth, while steady, was more modest, with a 85% increase, reaching around $1.58 billion in the same year.
This analysis underscores the dynamic nature of the industrial sector and the strategic maneuvers of its key players.
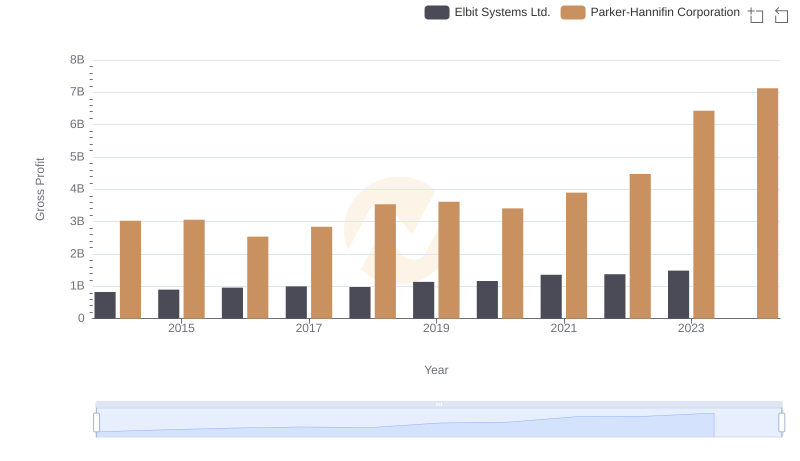
Gross Profit Trends Compared: Parker-Hannifin Corporation vs Elbit Systems Ltd.
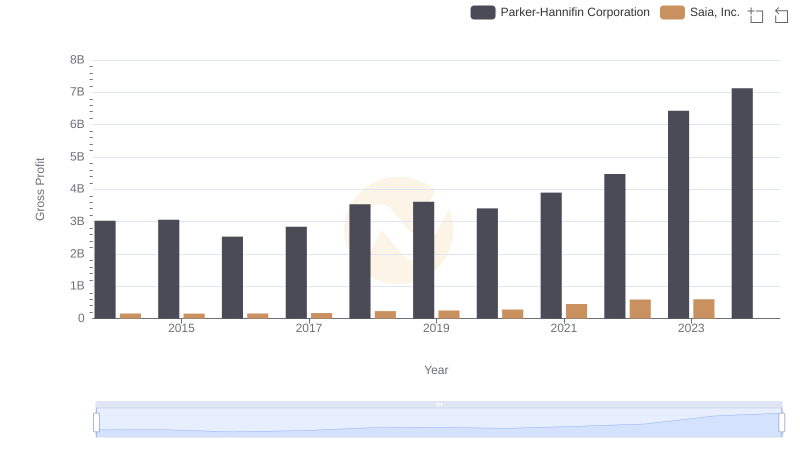
Gross Profit Trends Compared: Parker-Hannifin Corporation vs Saia, Inc.
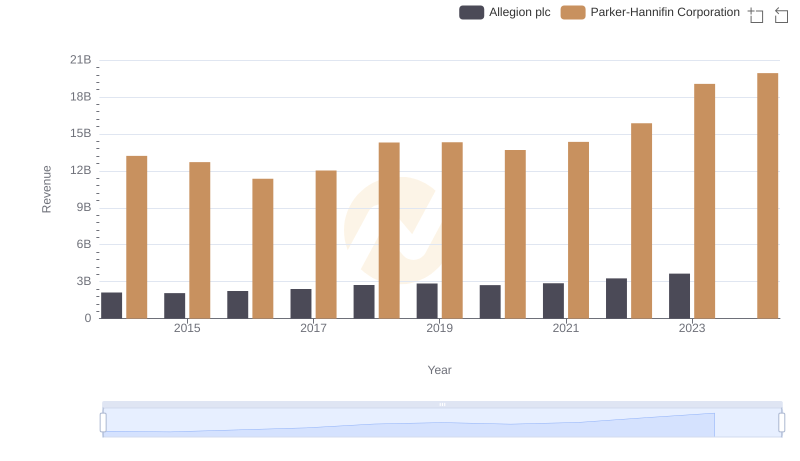
Breaking Down Revenue Trends: Parker-Hannifin Corporation vs Allegion plc
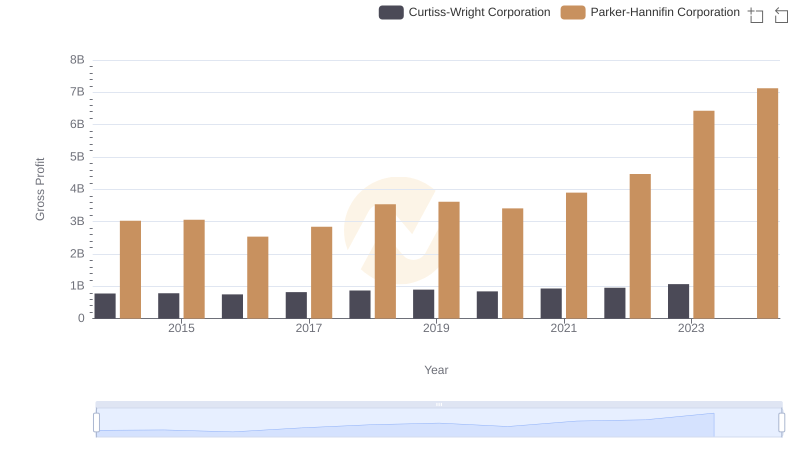
Who Generates Higher Gross Profit? Parker-Hannifin Corporation or Curtiss-Wright Corporation
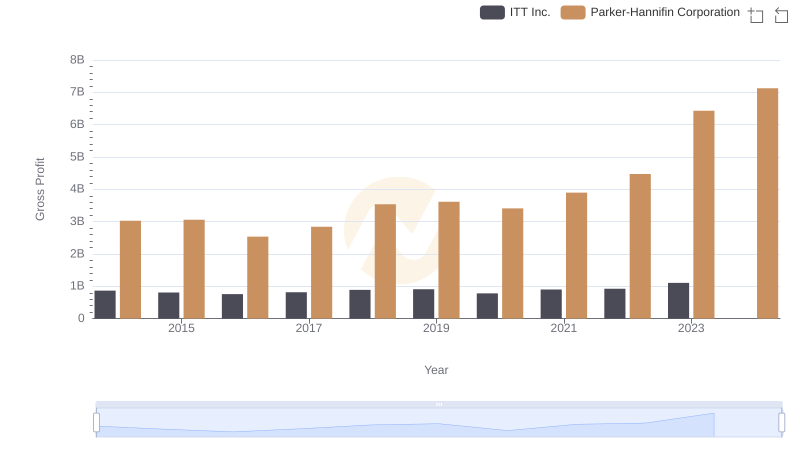
Key Insights on Gross Profit: Parker-Hannifin Corporation vs ITT Inc.
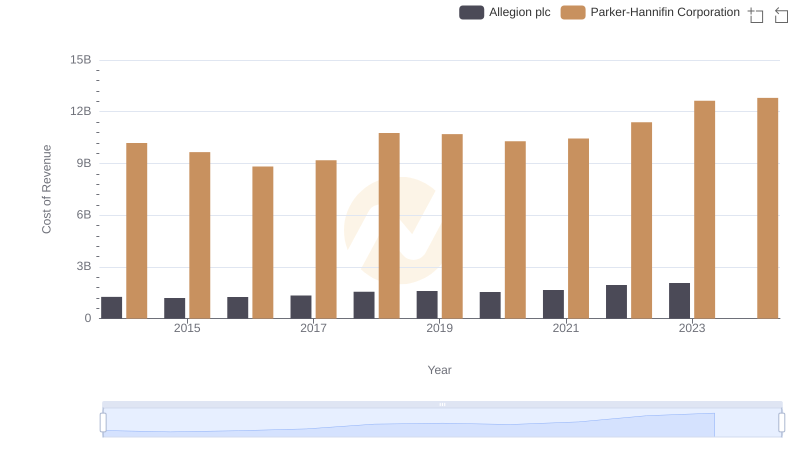
Cost of Revenue Comparison: Parker-Hannifin Corporation vs Allegion plc
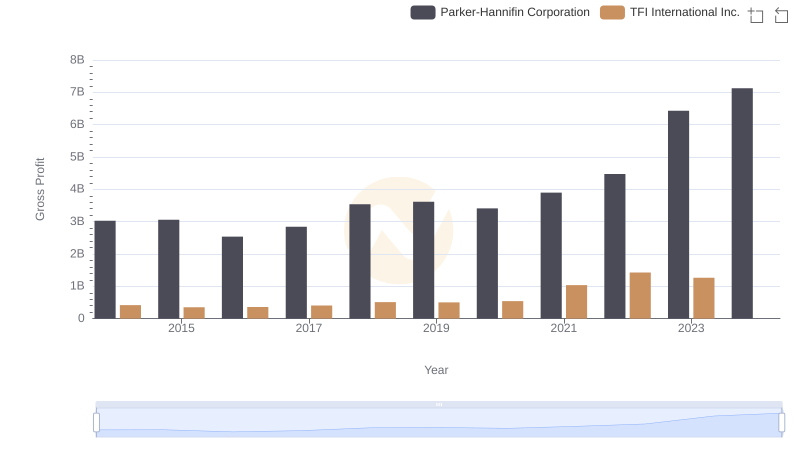
Gross Profit Comparison: Parker-Hannifin Corporation and TFI International Inc. Trends
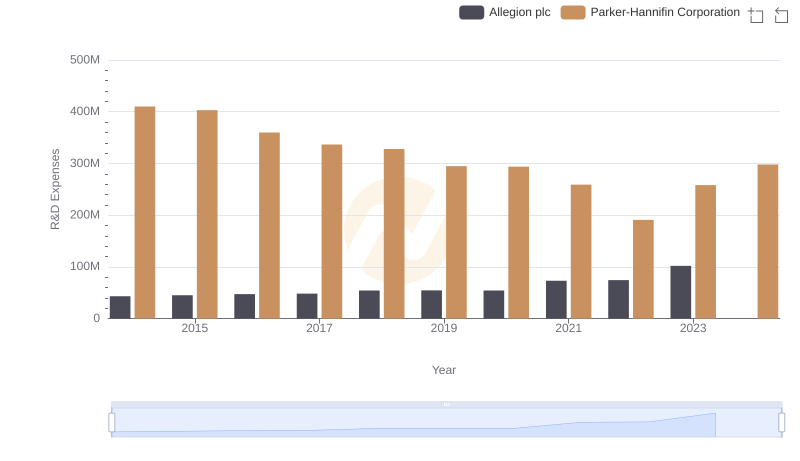
Research and Development Investment: Parker-Hannifin Corporation vs Allegion plc