| __timestamp | Allegion plc | Parker-Hannifin Corporation |
|---|---|---|
| Wednesday, January 1, 2014 | 2118300000 | 13215971000 |
| Thursday, January 1, 2015 | 2068100000 | 12711744000 |
| Friday, January 1, 2016 | 2238000000 | 11360753000 |
| Sunday, January 1, 2017 | 2408200000 | 12029312000 |
| Monday, January 1, 2018 | 2731700000 | 14302392000 |
| Tuesday, January 1, 2019 | 2854000000 | 14320324000 |
| Wednesday, January 1, 2020 | 2719900000 | 13695520000 |
| Friday, January 1, 2021 | 2867400000 | 14347640000 |
| Saturday, January 1, 2022 | 3271900000 | 15861608000 |
| Sunday, January 1, 2023 | 3650800000 | 19065194000 |
| Monday, January 1, 2024 | 3772200000 | 19929606000 |
Unleashing the power of data
In the ever-evolving landscape of industrial manufacturing, Parker-Hannifin Corporation and Allegion plc stand as titans, each carving its path through innovation and strategic growth. Over the past decade, Parker-Hannifin has consistently outpaced Allegion in revenue, showcasing a robust growth trajectory. From 2014 to 2023, Parker-Hannifin's revenue surged by approximately 44%, reaching nearly $19 billion in 2023. In contrast, Allegion plc, while smaller in scale, demonstrated a commendable growth of around 72% over the same period, peaking at $3.65 billion in 2023.
The data reveals a compelling narrative of resilience and adaptation, with both companies navigating economic fluctuations and market demands. Notably, Parker-Hannifin's revenue in 2024 is projected to approach $20 billion, although Allegion's data for this year remains unavailable. This comparison underscores the dynamic nature of the industrial sector and the strategic maneuvers of these industry leaders.
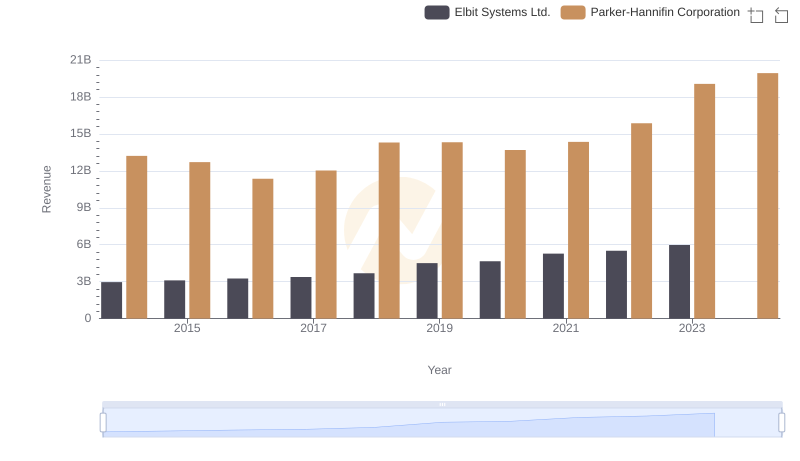
Comparing Revenue Performance: Parker-Hannifin Corporation or Elbit Systems Ltd.?
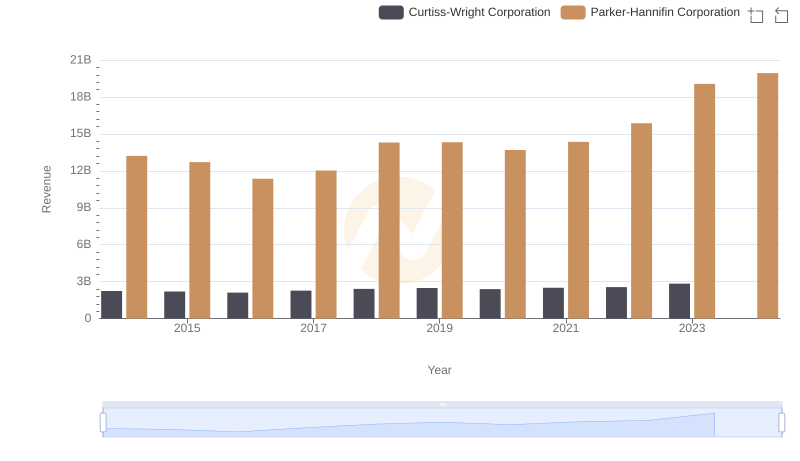
Parker-Hannifin Corporation or Curtiss-Wright Corporation: Who Leads in Yearly Revenue?
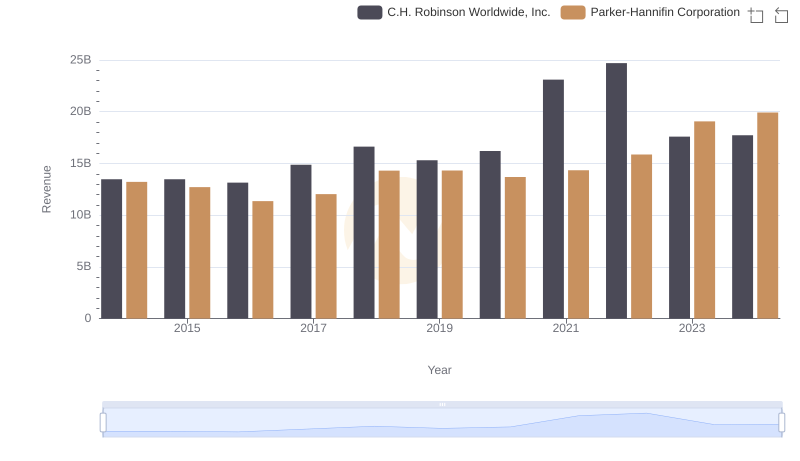
Revenue Insights: Parker-Hannifin Corporation and C.H. Robinson Worldwide, Inc. Performance Compared
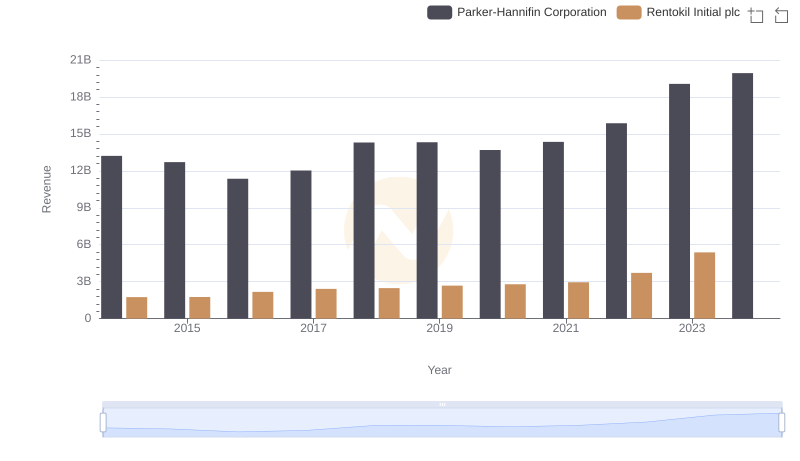
Parker-Hannifin Corporation and Rentokil Initial plc: A Comprehensive Revenue Analysis
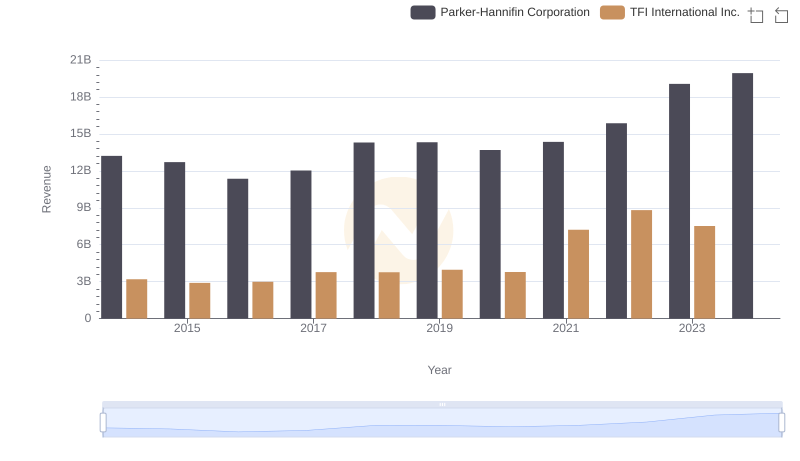
Parker-Hannifin Corporation vs TFI International Inc.: Annual Revenue Growth Compared
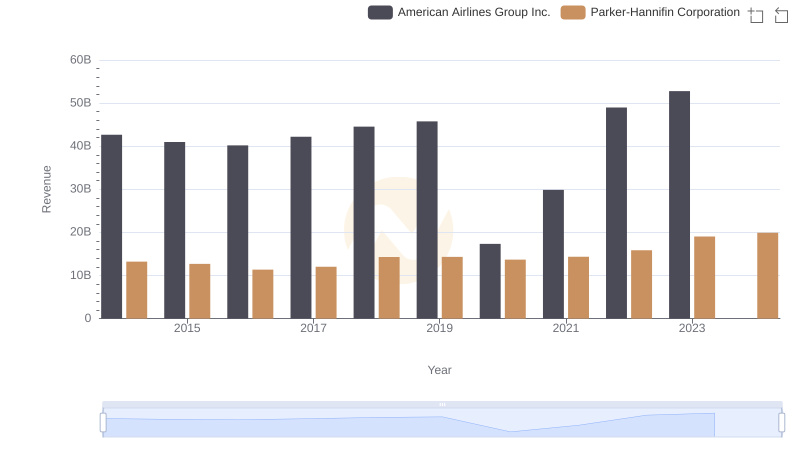
Revenue Insights: Parker-Hannifin Corporation and American Airlines Group Inc. Performance Compared
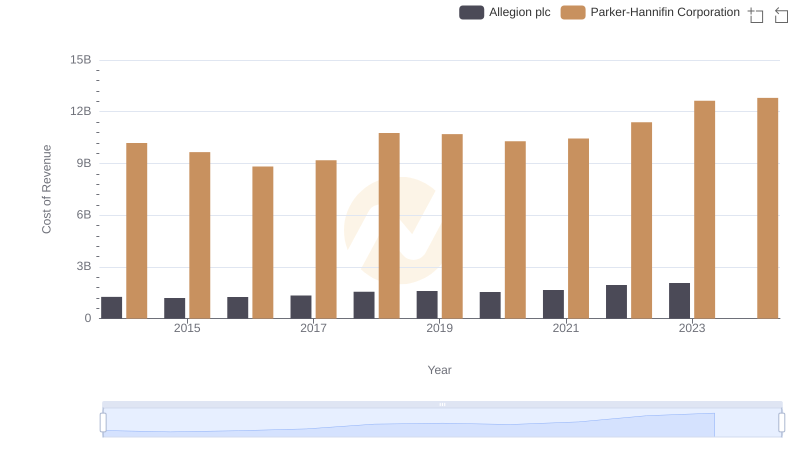
Cost of Revenue Comparison: Parker-Hannifin Corporation vs Allegion plc
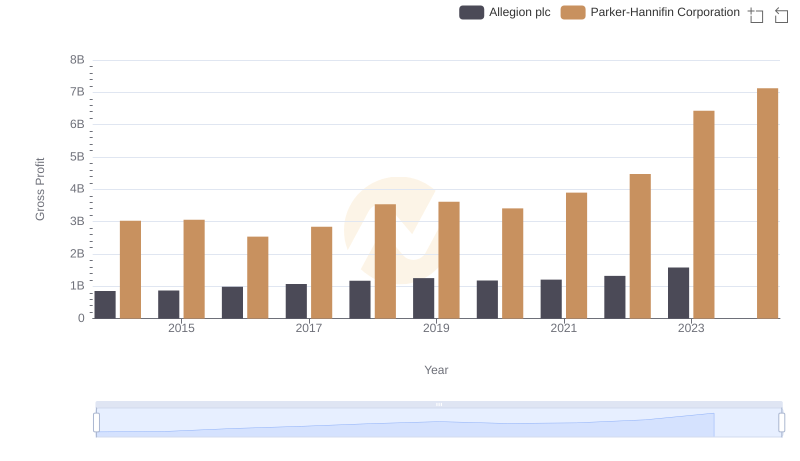
Who Generates Higher Gross Profit? Parker-Hannifin Corporation or Allegion plc
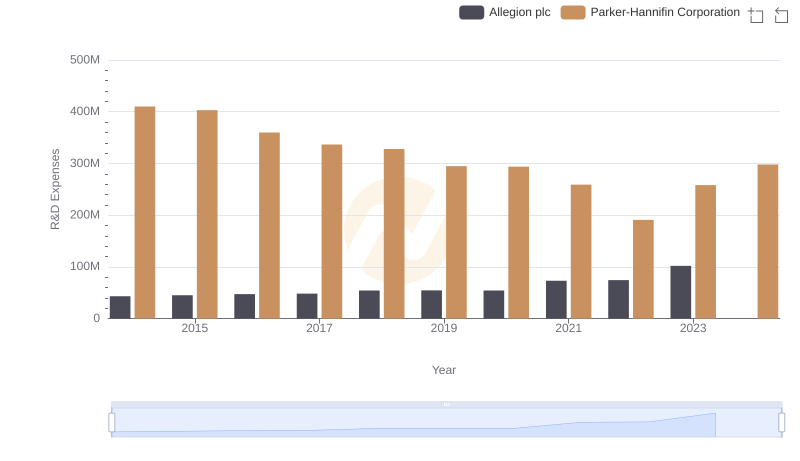
Research and Development Investment: Parker-Hannifin Corporation vs Allegion plc