| __timestamp | Cisco Systems, Inc. | Teradyne, Inc. |
|---|---|---|
| Wednesday, January 1, 2014 | 27769000000 | 878808000 |
| Thursday, January 1, 2015 | 29681000000 | 915643000 |
| Friday, January 1, 2016 | 30960000000 | 959567000 |
| Sunday, January 1, 2017 | 30224000000 | 1223872000 |
| Monday, January 1, 2018 | 30606000000 | 1220394000 |
| Tuesday, January 1, 2019 | 32666000000 | 1339829000 |
| Wednesday, January 1, 2020 | 31683000000 | 1785741000 |
| Friday, January 1, 2021 | 31894000000 | 2206656000 |
| Saturday, January 1, 2022 | 32248000000 | 1867151000 |
| Sunday, January 1, 2023 | 35753000000 | 1536748000 |
| Monday, January 1, 2024 | 34828000000 | 1648927000 |
Unleashing insights
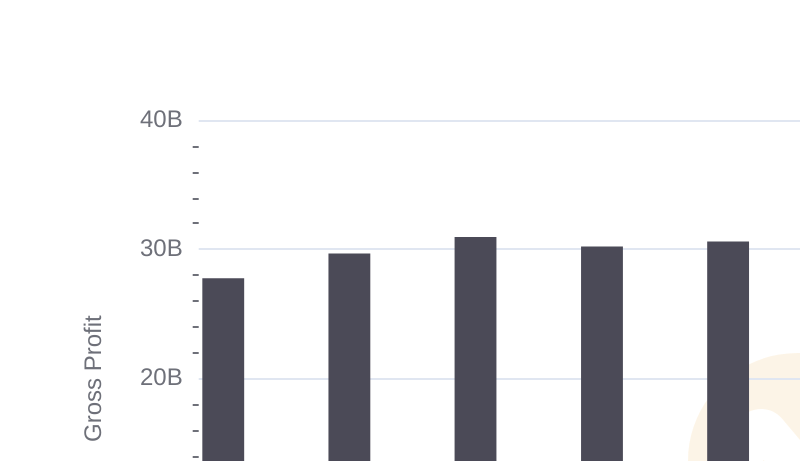
In the ever-evolving landscape of technology, Cisco Systems, Inc. and Teradyne, Inc. have carved distinct paths over the past decade. From 2014 to 2023, Cisco's gross profit has shown a robust upward trend, peaking in 2023 with a remarkable 29% increase from its 2014 figures. This growth underscores Cisco's resilience and adaptability in a competitive market.
Conversely, Teradyne, Inc. has experienced a more volatile journey. While it achieved a significant 151% increase in gross profit from 2014 to 2021, recent years have seen fluctuations, with a notable dip in 2023. This variability highlights the challenges faced by companies in the semiconductor testing industry.
As we look to the future, the missing data for 2024 leaves room for speculation. Will Cisco maintain its upward trajectory, and can Teradyne stabilize its growth? Only time will tell.
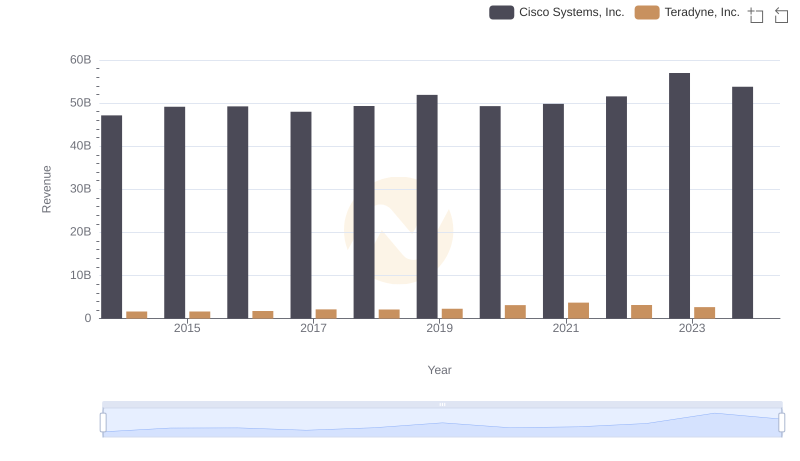
Who Generates More Revenue? Cisco Systems, Inc. or Teradyne, Inc.
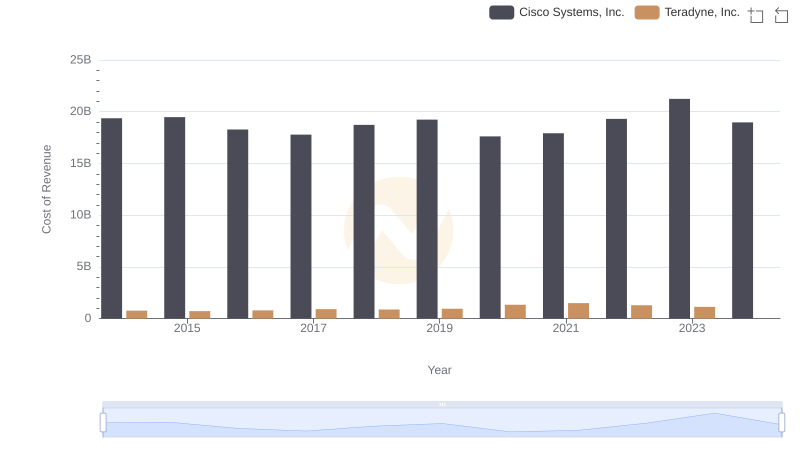
Cost of Revenue Comparison: Cisco Systems, Inc. vs Teradyne, Inc.

Gross Profit Analysis: Comparing Cisco Systems, Inc. and Leidos Holdings, Inc.
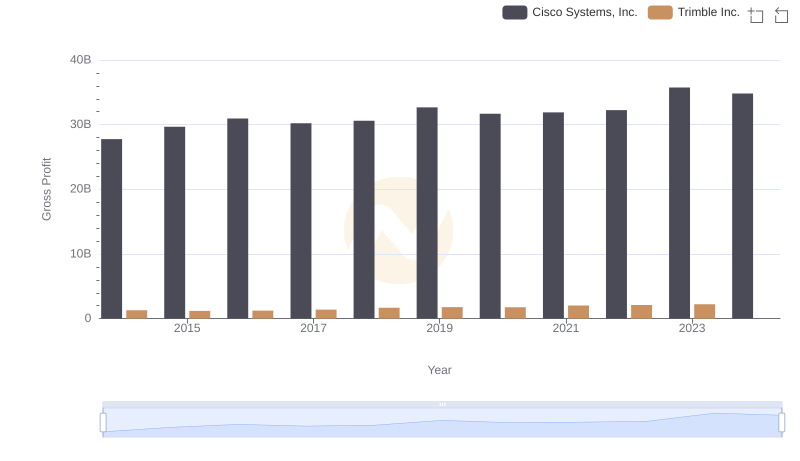
Key Insights on Gross Profit: Cisco Systems, Inc. vs Trimble Inc.

Cisco Systems, Inc. and Manhattan Associates, Inc.: A Detailed Gross Profit Analysis
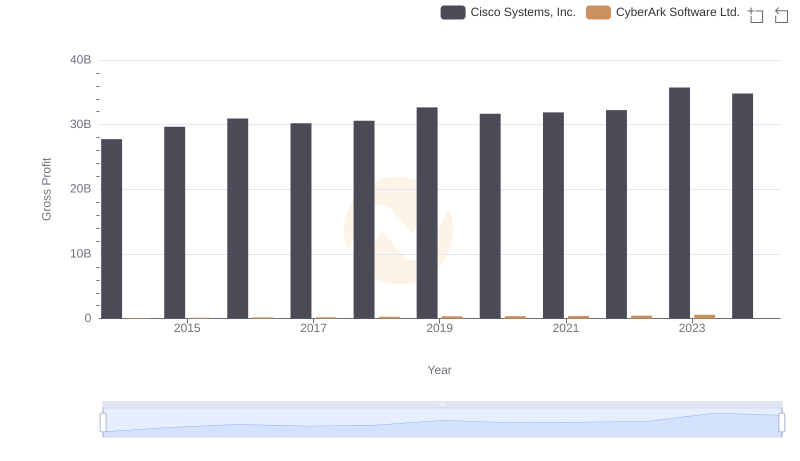
Gross Profit Analysis: Comparing Cisco Systems, Inc. and CyberArk Software Ltd.

Gross Profit Analysis: Comparing Cisco Systems, Inc. and Guidewire Software, Inc.
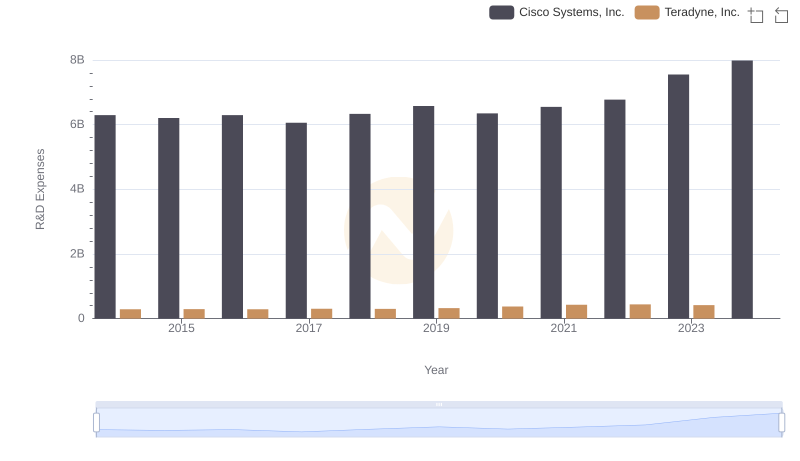
Research and Development Expenses Breakdown: Cisco Systems, Inc. vs Teradyne, Inc.

Cisco Systems, Inc. vs Super Micro Computer, Inc.: A Gross Profit Performance Breakdown
Cisco Systems, Inc. and Jabil Inc.: A Detailed Gross Profit Analysis
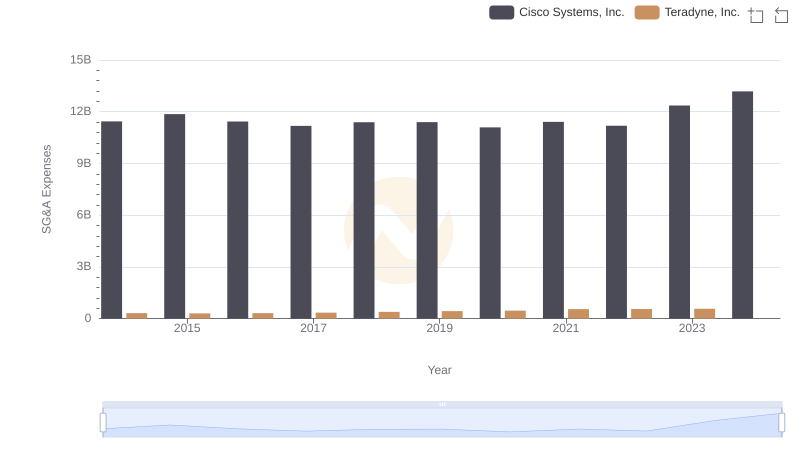
Cisco Systems, Inc. or Teradyne, Inc.: Who Manages SG&A Costs Better?
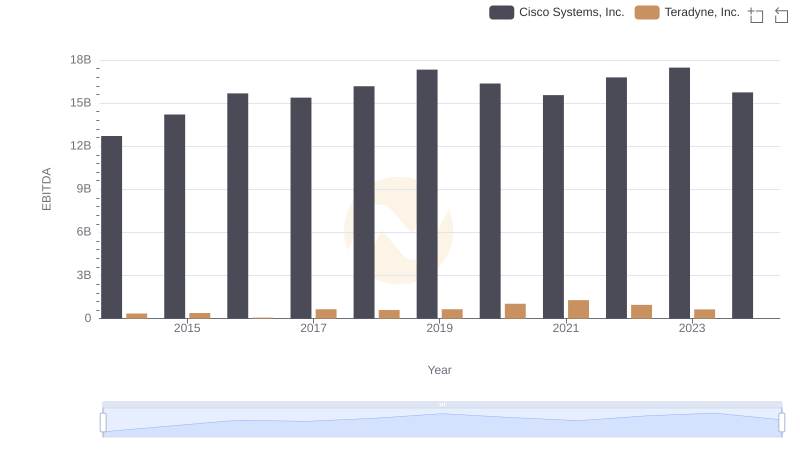
A Side-by-Side Analysis of EBITDA: Cisco Systems, Inc. and Teradyne, Inc.