| __timestamp | Cisco Systems, Inc. | QUALCOMM Incorporated |
|---|---|---|
| Wednesday, January 1, 2014 | 47142000000 | 26487000000 |
| Thursday, January 1, 2015 | 49161000000 | 25281000000 |
| Friday, January 1, 2016 | 49247000000 | 23554000000 |
| Sunday, January 1, 2017 | 48005000000 | 22291000000 |
| Monday, January 1, 2018 | 49330000000 | 22732000000 |
| Tuesday, January 1, 2019 | 51904000000 | 24273000000 |
| Wednesday, January 1, 2020 | 49301000000 | 23531000000 |
| Friday, January 1, 2021 | 49818000000 | 33566000000 |
| Saturday, January 1, 2022 | 51557000000 | 44200000000 |
| Sunday, January 1, 2023 | 56998000000 | 35820000000 |
| Monday, January 1, 2024 | 53803000000 | 38962000000 |
Unlocking the unknown
In the ever-evolving landscape of technology, Cisco Systems, Inc. and QUALCOMM Incorporated have been pivotal players. Over the past decade, these giants have showcased contrasting revenue trajectories. From 2014 to 2024, Cisco's revenue grew by approximately 14%, peaking in 2023 with a 20% increase from its 2014 figures. Meanwhile, Qualcomm experienced a more volatile journey, with a notable 67% surge in revenue from 2017 to 2022, before a slight dip in 2023.
As we look to the future, these trends highlight the dynamic nature of the tech industry, where innovation and adaptability are key to sustained growth.
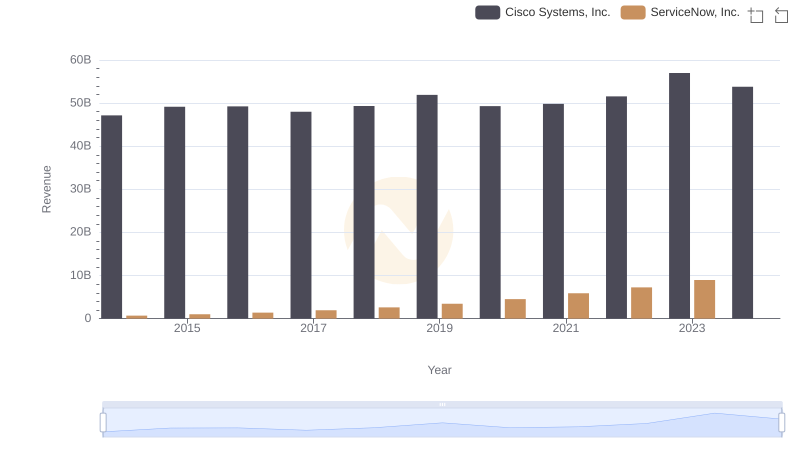
Cisco Systems, Inc. or ServiceNow, Inc.: Who Leads in Yearly Revenue?
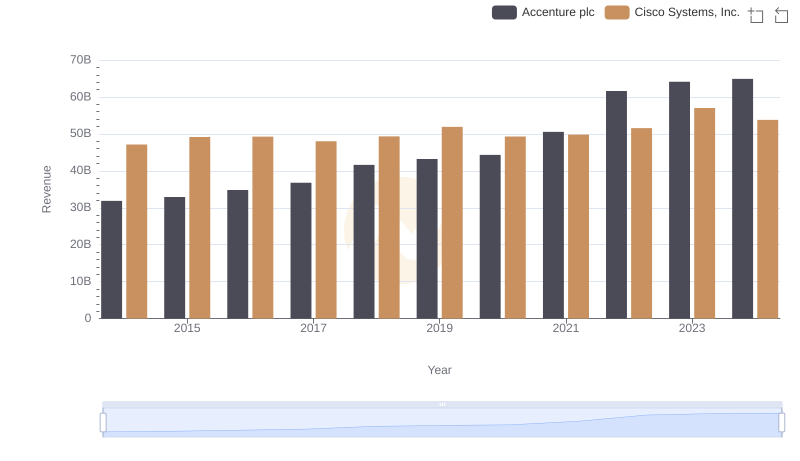
Cisco Systems, Inc. vs Accenture plc: Examining Key Revenue Metrics
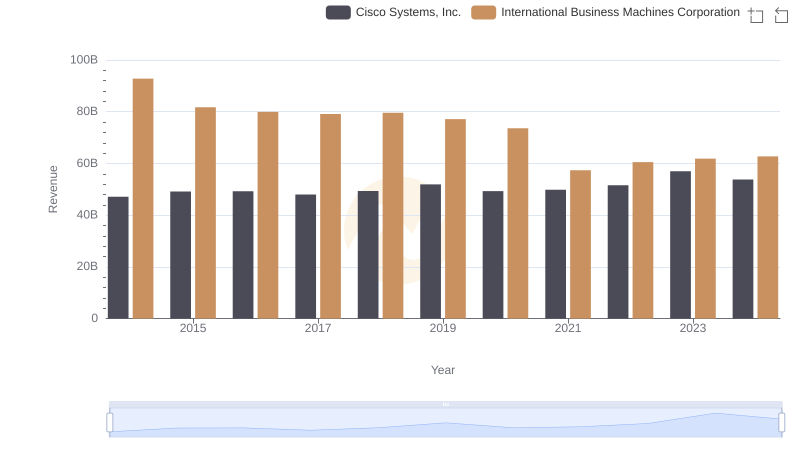
Breaking Down Revenue Trends: Cisco Systems, Inc. vs International Business Machines Corporation
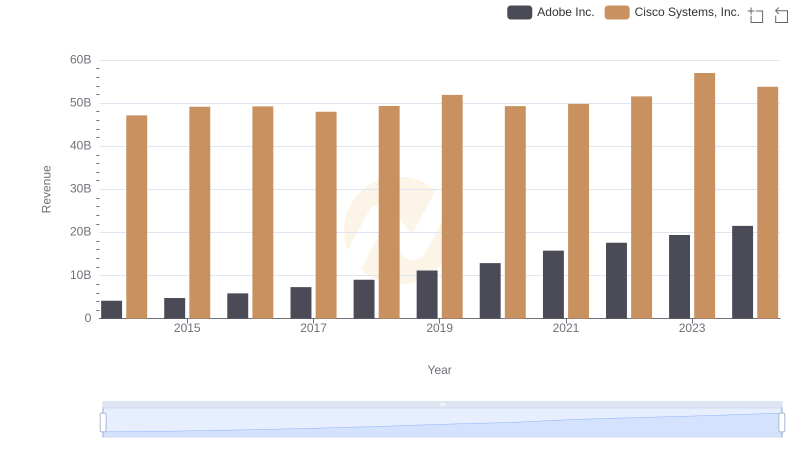
Cisco Systems, Inc. vs Adobe Inc.: Examining Key Revenue Metrics
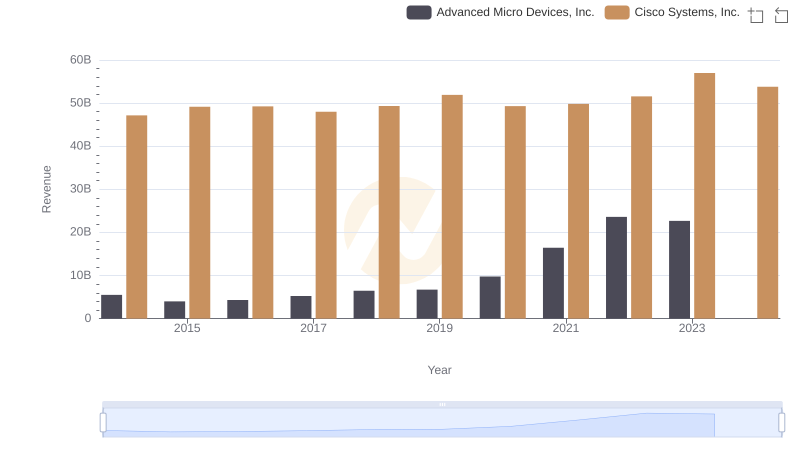
Cisco Systems, Inc. or Advanced Micro Devices, Inc.: Who Leads in Yearly Revenue?
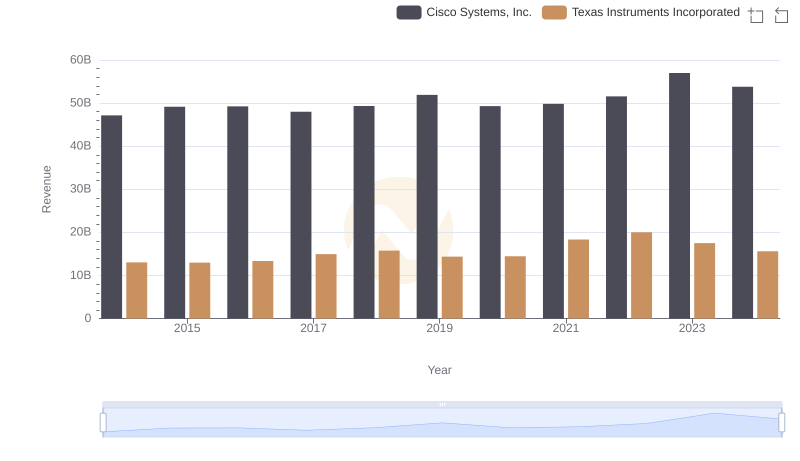
Breaking Down Revenue Trends: Cisco Systems, Inc. vs Texas Instruments Incorporated
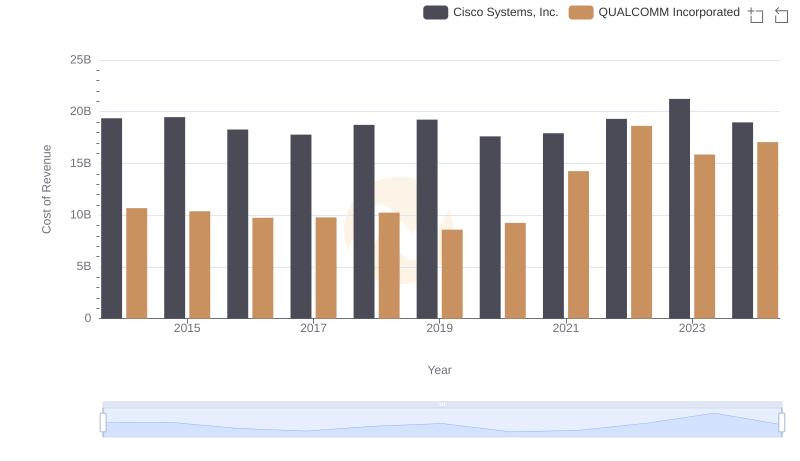
Cost of Revenue Comparison: Cisco Systems, Inc. vs QUALCOMM Incorporated
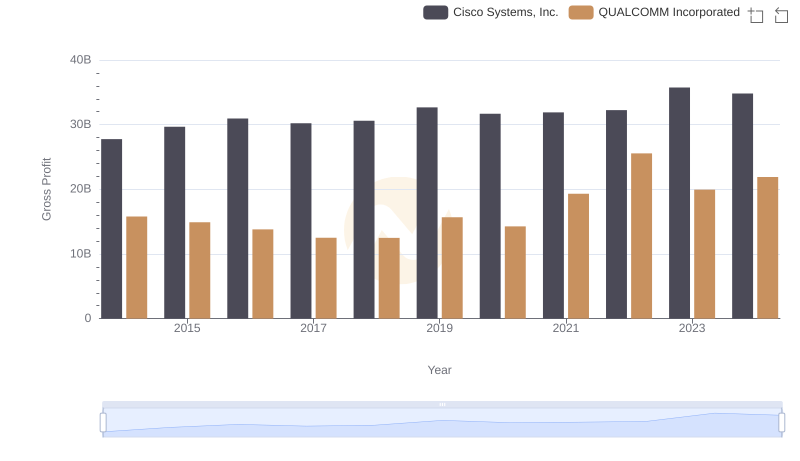
Who Generates Higher Gross Profit? Cisco Systems, Inc. or QUALCOMM Incorporated
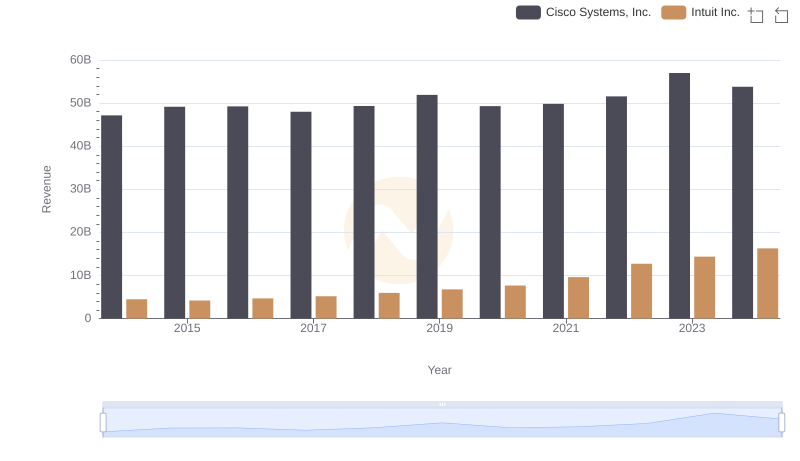
Revenue Showdown: Cisco Systems, Inc. vs Intuit Inc.
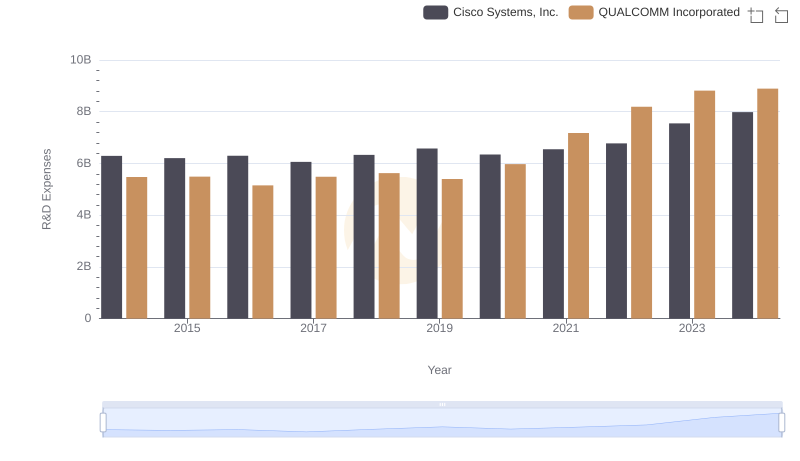
Research and Development Investment: Cisco Systems, Inc. vs QUALCOMM Incorporated
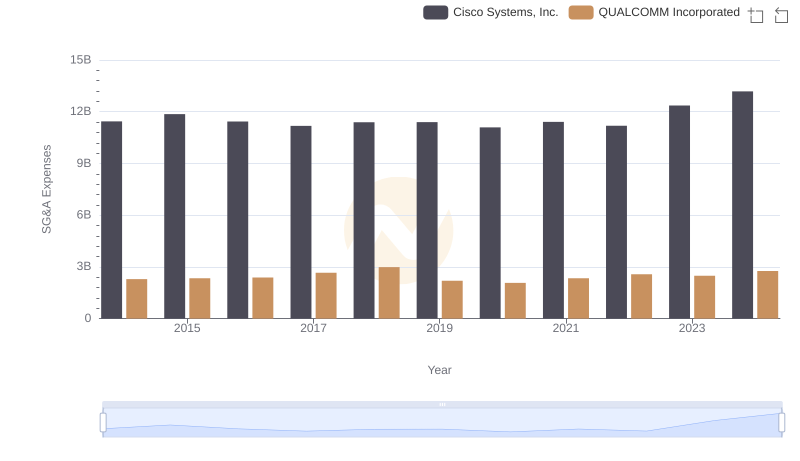
SG&A Efficiency Analysis: Comparing Cisco Systems, Inc. and QUALCOMM Incorporated
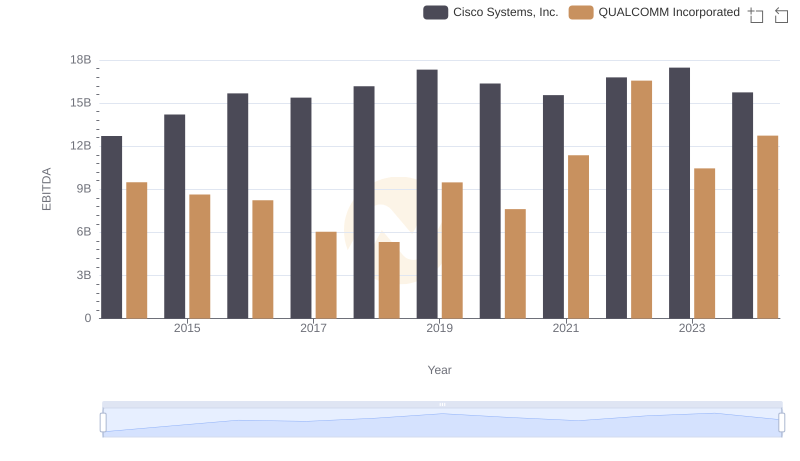
Cisco Systems, Inc. and QUALCOMM Incorporated: A Detailed Examination of EBITDA Performance