| __timestamp | Cisco Systems, Inc. | QUALCOMM Incorporated |
|---|---|---|
| Wednesday, January 1, 2014 | 12709000000 | 9490000000 |
| Thursday, January 1, 2015 | 14209000000 | 8641000000 |
| Friday, January 1, 2016 | 15678000000 | 8240000000 |
| Sunday, January 1, 2017 | 15383000000 | 6043000000 |
| Monday, January 1, 2018 | 16172000000 | 5335000000 |
| Tuesday, January 1, 2019 | 17334000000 | 9482000000 |
| Wednesday, January 1, 2020 | 16363000000 | 7620000000 |
| Friday, January 1, 2021 | 15558000000 | 11371000000 |
| Saturday, January 1, 2022 | 16794000000 | 16563000000 |
| Sunday, January 1, 2023 | 17471000000 | 10459000000 |
| Monday, January 1, 2024 | 15747000000 | 12739000000 |
Igniting the spark of knowledge
In the ever-evolving tech industry, understanding financial performance is crucial. This analysis delves into the EBITDA trends of two giants: Cisco Systems, Inc. and QUALCOMM Incorporated, from 2014 to 2024. Over this decade, Cisco consistently outperformed QUALCOMM, with an average EBITDA approximately 64% higher. Notably, Cisco's EBITDA peaked in 2023, marking a 37% increase from 2014, while QUALCOMM saw its highest EBITDA in 2022, a remarkable 75% rise from its 2014 figures.
These insights highlight the dynamic nature of the tech sector, where strategic decisions and market conditions significantly impact financial outcomes.
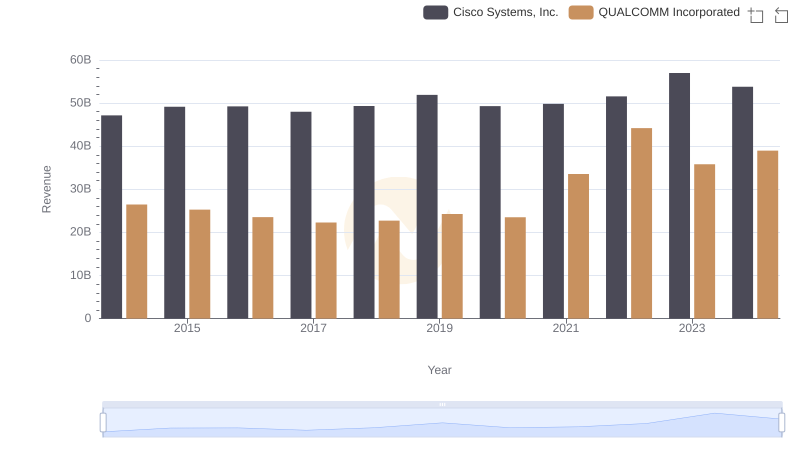
Cisco Systems, Inc. vs QUALCOMM Incorporated: Annual Revenue Growth Compared
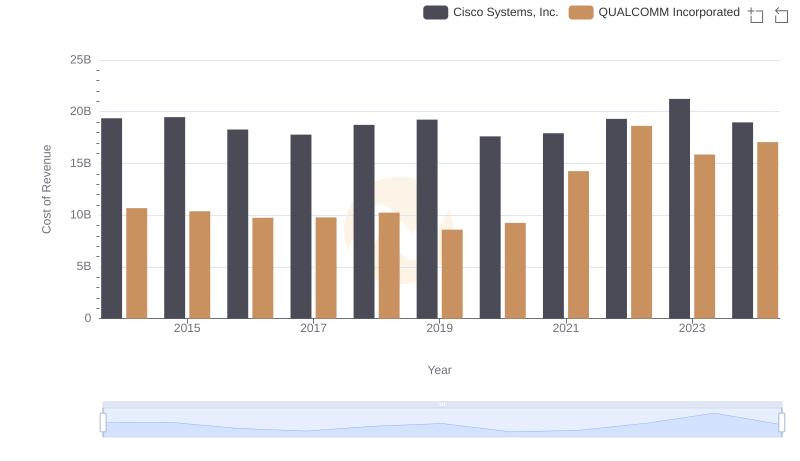
Cost of Revenue Comparison: Cisco Systems, Inc. vs QUALCOMM Incorporated
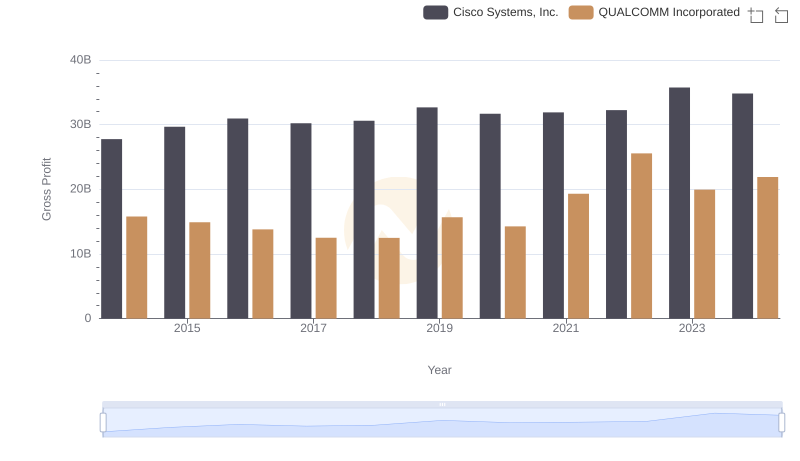
Who Generates Higher Gross Profit? Cisco Systems, Inc. or QUALCOMM Incorporated
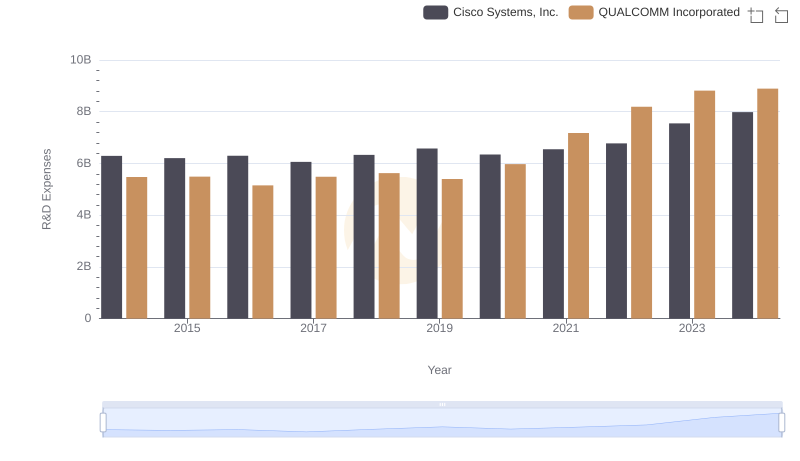
Research and Development Investment: Cisco Systems, Inc. vs QUALCOMM Incorporated
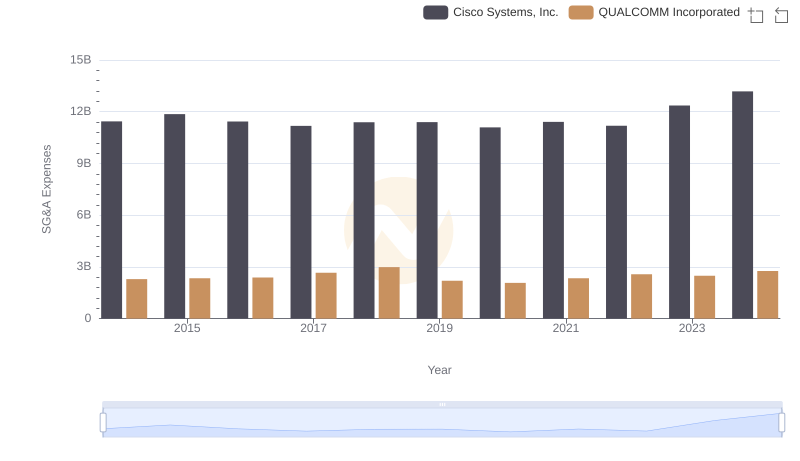
SG&A Efficiency Analysis: Comparing Cisco Systems, Inc. and QUALCOMM Incorporated
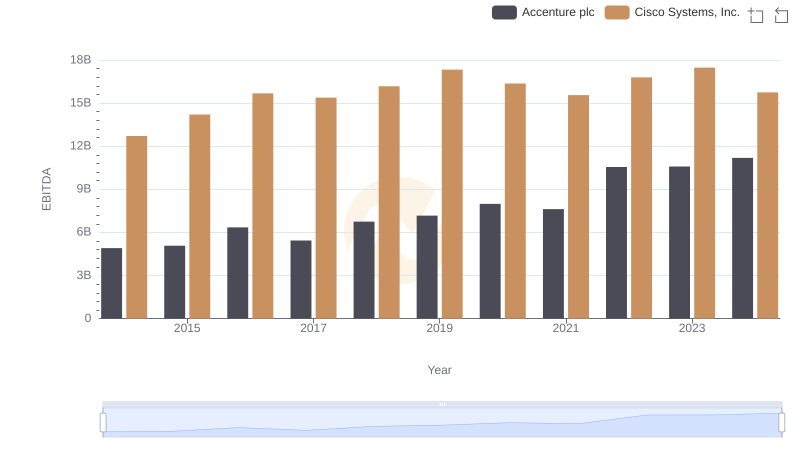
Cisco Systems, Inc. vs Accenture plc: In-Depth EBITDA Performance Comparison
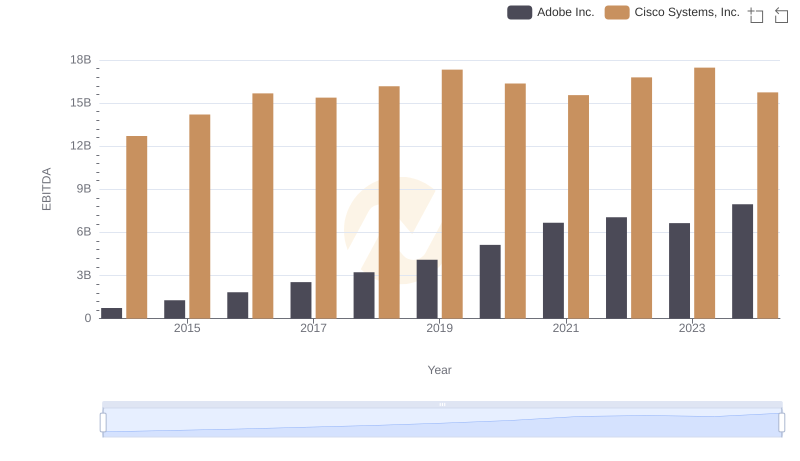
A Professional Review of EBITDA: Cisco Systems, Inc. Compared to Adobe Inc.
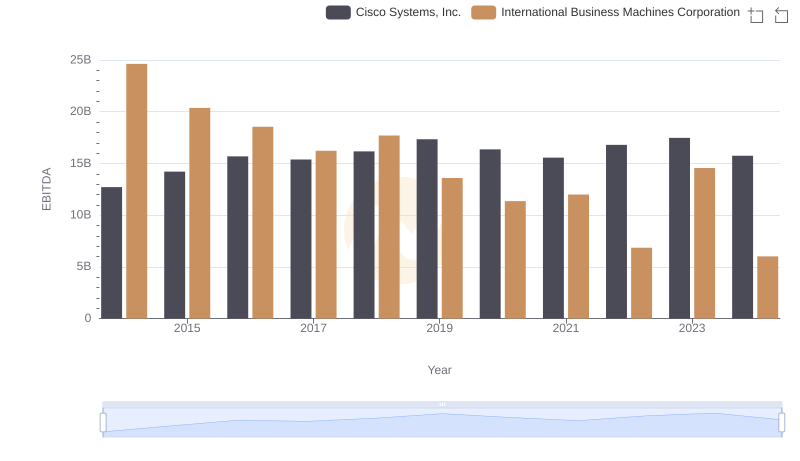
Cisco Systems, Inc. and International Business Machines Corporation: A Detailed Examination of EBITDA Performance
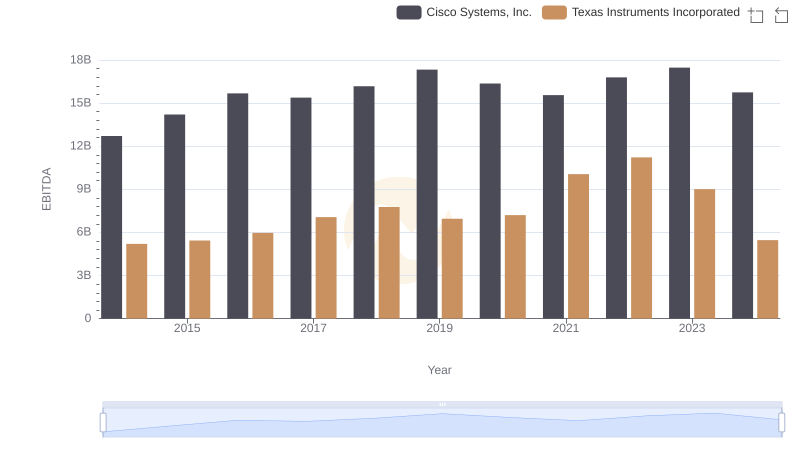
Cisco Systems, Inc. vs Texas Instruments Incorporated: In-Depth EBITDA Performance Comparison
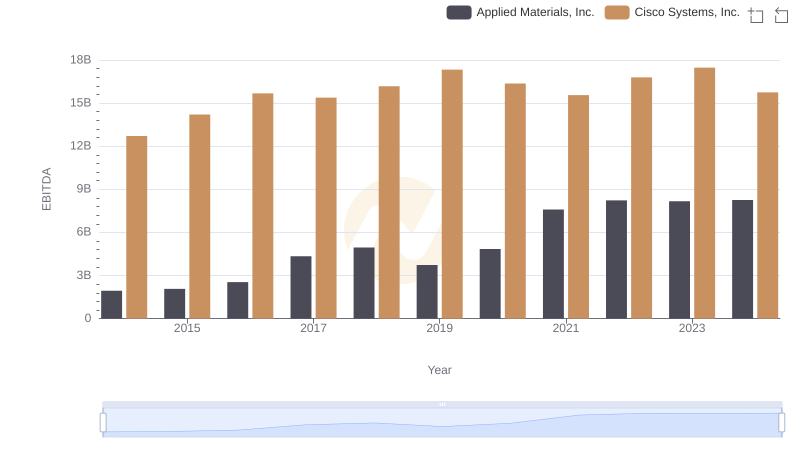
EBITDA Performance Review: Cisco Systems, Inc. vs Applied Materials, Inc.
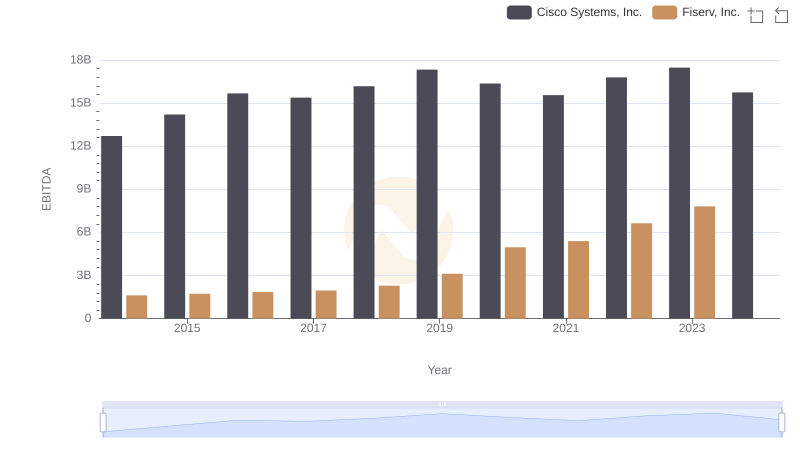
EBITDA Analysis: Evaluating Cisco Systems, Inc. Against Fiserv, Inc.
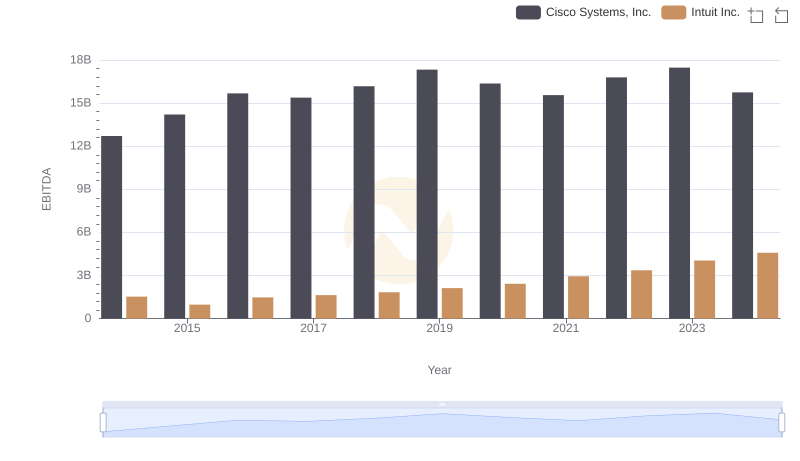
Cisco Systems, Inc. vs Intuit Inc.: In-Depth EBITDA Performance Comparison