| __timestamp | Analog Devices, Inc. | Fortinet, Inc. |
|---|---|---|
| Wednesday, January 1, 2014 | 1034585000 | 231009000 |
| Thursday, January 1, 2015 | 1175830000 | 286777000 |
| Friday, January 1, 2016 | 1194236000 | 337837000 |
| Sunday, January 1, 2017 | 2045907000 | 385284000 |
| Monday, January 1, 2018 | 1967640000 | 450400000 |
| Tuesday, January 1, 2019 | 1977315000 | 505900000 |
| Wednesday, January 1, 2020 | 1912578000 | 570000000 |
| Friday, January 1, 2021 | 2793274000 | 783000000 |
| Saturday, January 1, 2022 | 4481479000 | 1084900000 |
| Sunday, January 1, 2023 | 4428321000 | 1237200000 |
| Monday, January 1, 2024 | 4045814000 | 1157600000 |
Unleashing insights
In the ever-evolving landscape of technology, understanding cost structures is crucial. From 2014 to 2023, Analog Devices, Inc. and Fortinet, Inc. have shown distinct trajectories in their cost of revenue. Analog Devices, Inc. experienced a significant increase, with costs rising by over 300% from 2014 to 2023. This surge reflects their strategic investments and expansion in the semiconductor industry. In contrast, Fortinet, Inc. saw a more moderate increase of approximately 435% over the same period, highlighting their steady growth in the cybersecurity sector. Notably, 2023 marked a peak for both companies, with Analog Devices reaching its highest cost of revenue, while Fortinet continued its upward trend. However, data for 2024 is incomplete, leaving room for speculation on future developments. These insights underscore the dynamic nature of cost management in tech giants, offering a glimpse into their operational strategies.
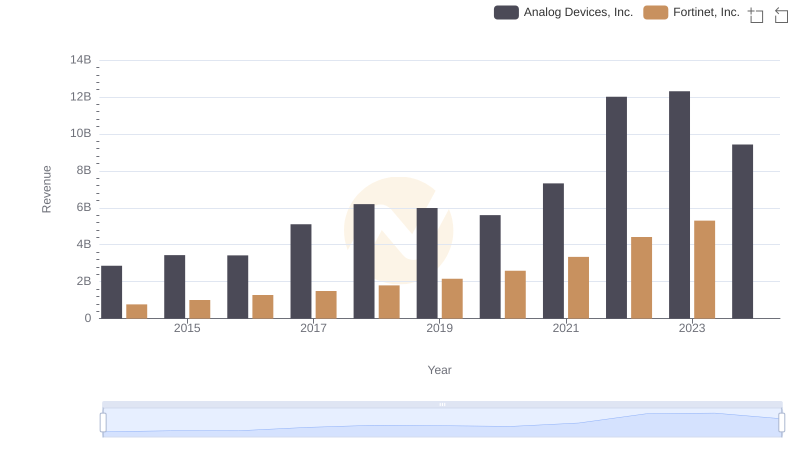
Analog Devices, Inc. or Fortinet, Inc.: Who Leads in Yearly Revenue?
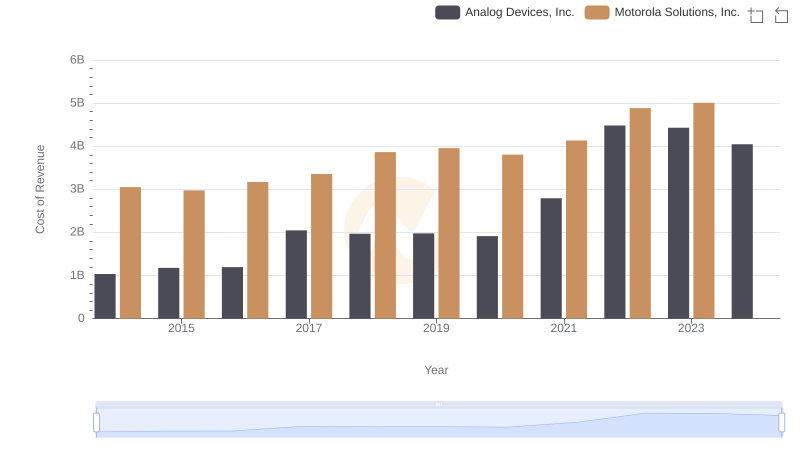
Cost of Revenue Comparison: Analog Devices, Inc. vs Motorola Solutions, Inc.
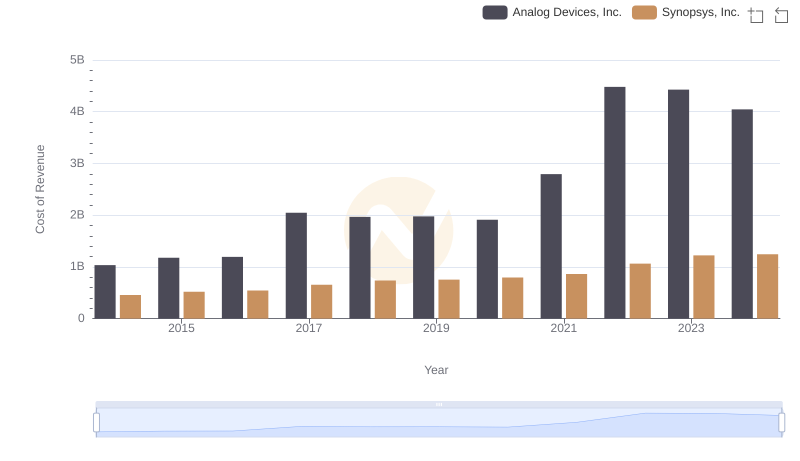
Analog Devices, Inc. vs Synopsys, Inc.: Efficiency in Cost of Revenue Explored
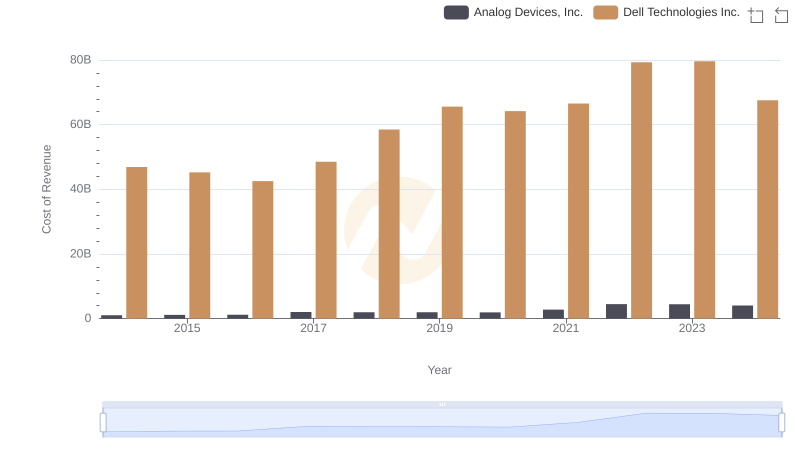
Cost of Revenue: Key Insights for Analog Devices, Inc. and Dell Technologies Inc.
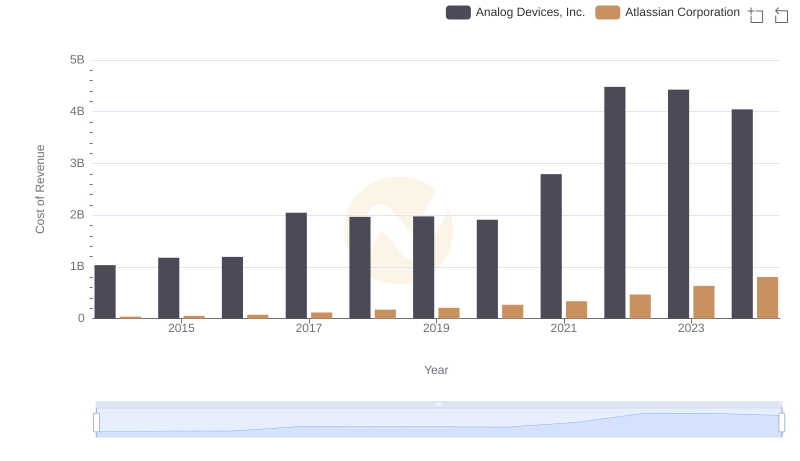
Cost Insights: Breaking Down Analog Devices, Inc. and Atlassian Corporation's Expenses
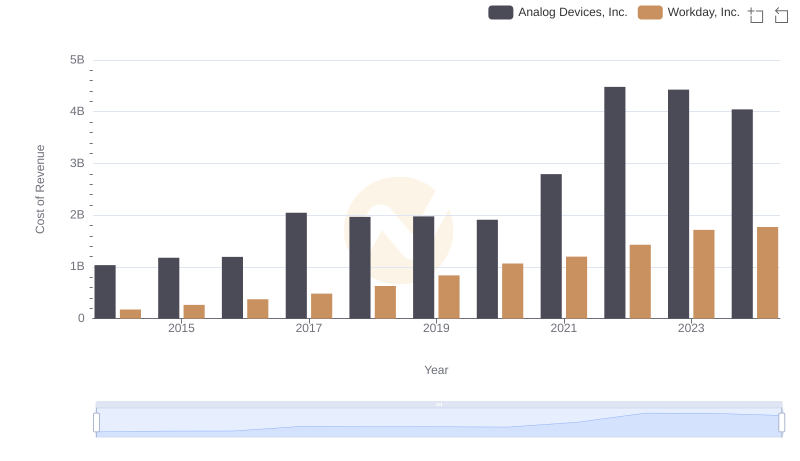
Comparing Cost of Revenue Efficiency: Analog Devices, Inc. vs Workday, Inc.
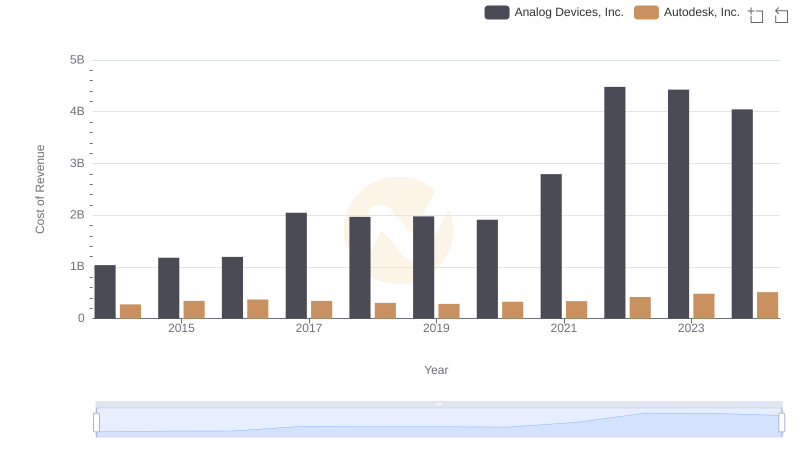
Analyzing Cost of Revenue: Analog Devices, Inc. and Autodesk, Inc.
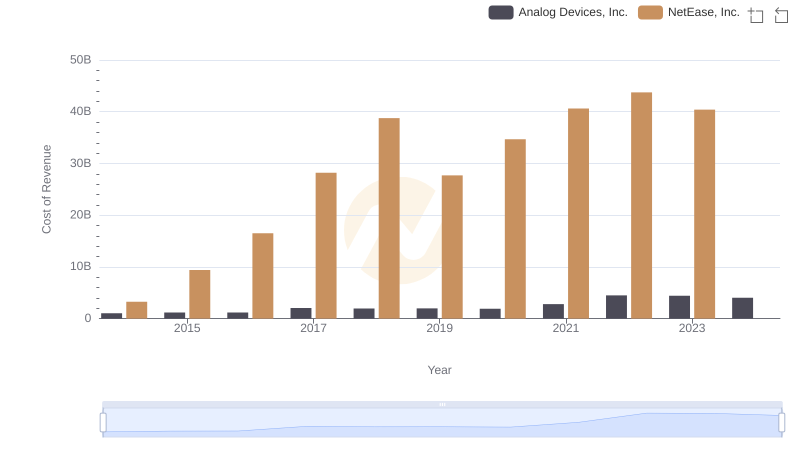
Comparing Cost of Revenue Efficiency: Analog Devices, Inc. vs NetEase, Inc.
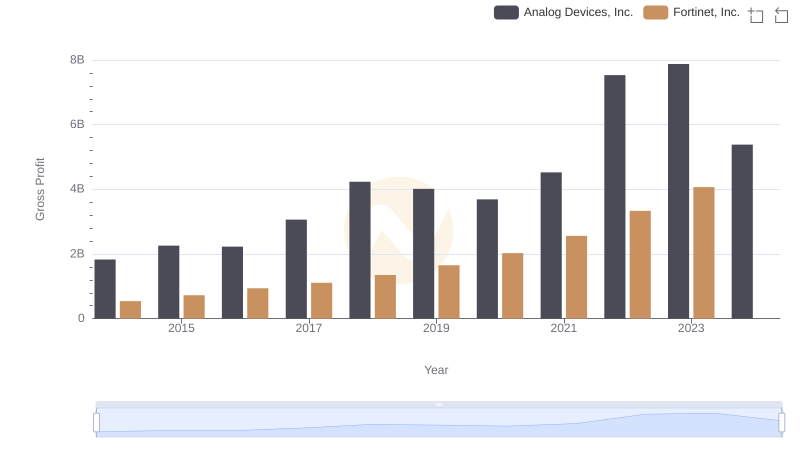
Gross Profit Trends Compared: Analog Devices, Inc. vs Fortinet, Inc.
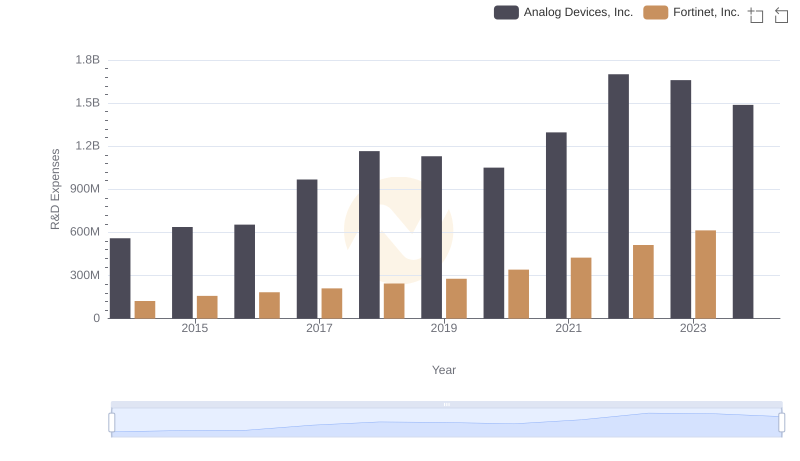
Who Prioritizes Innovation? R&D Spending Compared for Analog Devices, Inc. and Fortinet, Inc.
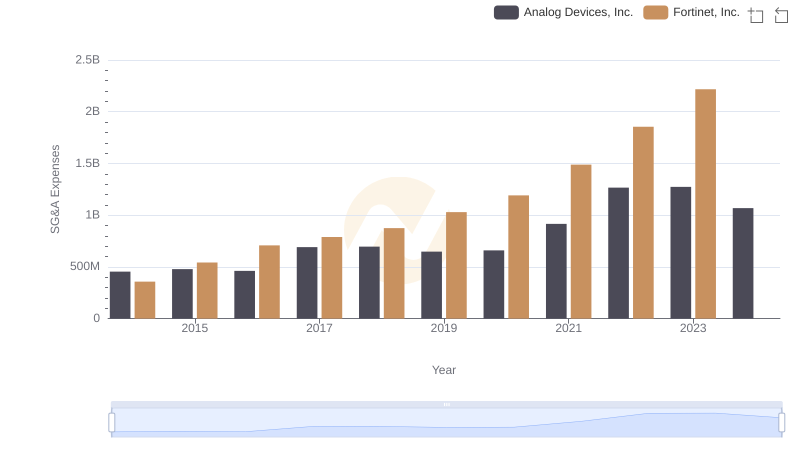
Operational Costs Compared: SG&A Analysis of Analog Devices, Inc. and Fortinet, Inc.
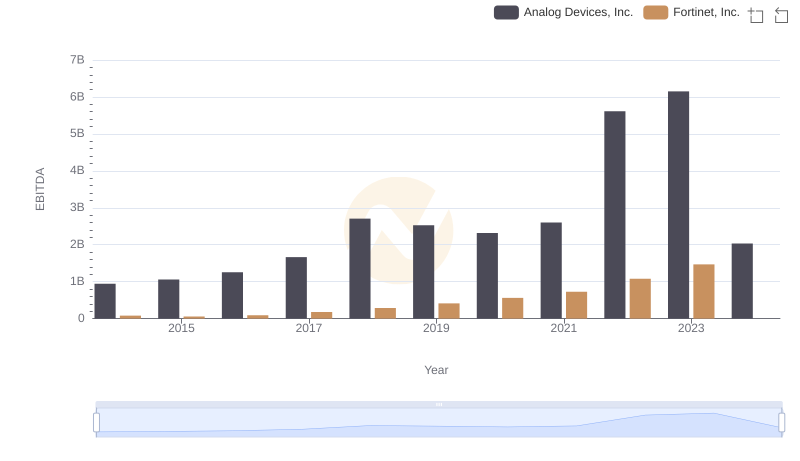
Analog Devices, Inc. and Fortinet, Inc.: A Detailed Examination of EBITDA Performance