| __timestamp | Analog Devices, Inc. | Dell Technologies Inc. |
|---|---|---|
| Wednesday, January 1, 2014 | 1034585000 | 46892000000 |
| Thursday, January 1, 2015 | 1175830000 | 45246000000 |
| Friday, January 1, 2016 | 1194236000 | 42524000000 |
| Sunday, January 1, 2017 | 2045907000 | 48515000000 |
| Monday, January 1, 2018 | 1967640000 | 58503000000 |
| Tuesday, January 1, 2019 | 1977315000 | 65568000000 |
| Wednesday, January 1, 2020 | 1912578000 | 64176000000 |
| Friday, January 1, 2021 | 2793274000 | 66530000000 |
| Saturday, January 1, 2022 | 4481479000 | 79306000000 |
| Sunday, January 1, 2023 | 4428321000 | 79615000000 |
| Monday, January 1, 2024 | 4045814000 | 67556000000 |
Data in motion
In the ever-evolving landscape of technology, understanding the cost of revenue is crucial for assessing a company's financial health. From 2014 to 2024, Analog Devices, Inc. and Dell Technologies Inc. have shown distinct trajectories in their cost of revenue. Analog Devices, Inc. experienced a significant increase, peaking in 2022 with a 333% rise from 2014. Meanwhile, Dell Technologies Inc. maintained a robust cost of revenue, with a 70% increase over the same period, reaching its zenith in 2023. This data highlights the contrasting business models and market strategies of these tech giants. While Analog Devices, Inc. has seen fluctuations, Dell Technologies Inc. has demonstrated consistent growth. These insights provide a window into the operational efficiencies and market dynamics that shape the tech industry today.
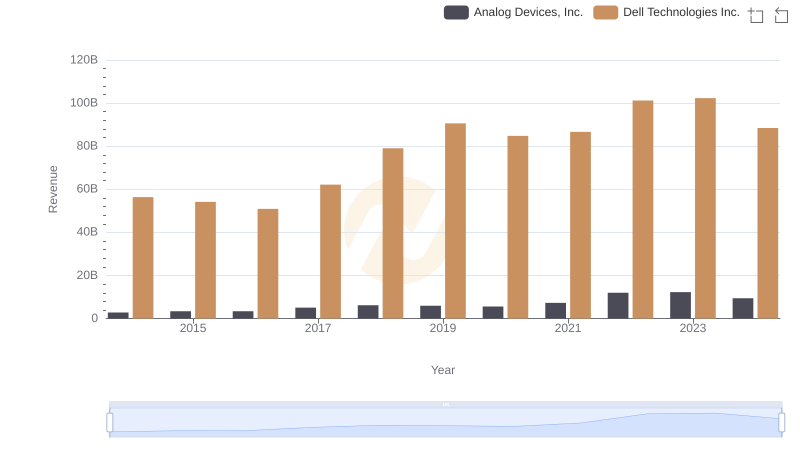
Analog Devices, Inc. and Dell Technologies Inc.: A Comprehensive Revenue Analysis
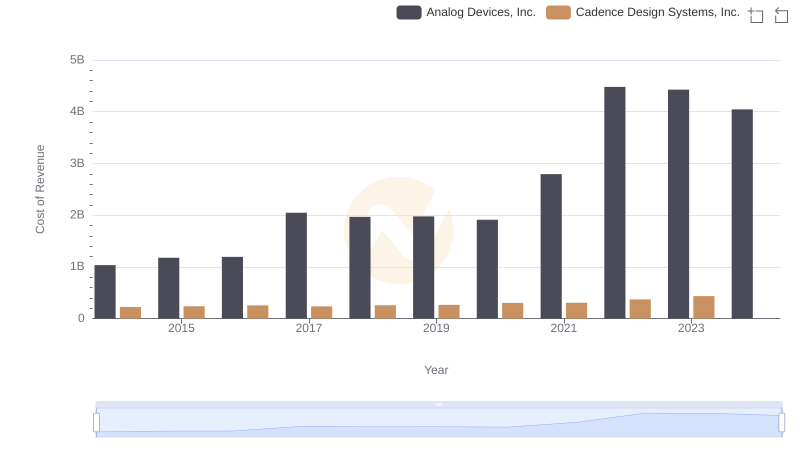
Analog Devices, Inc. vs Cadence Design Systems, Inc.: Efficiency in Cost of Revenue Explored
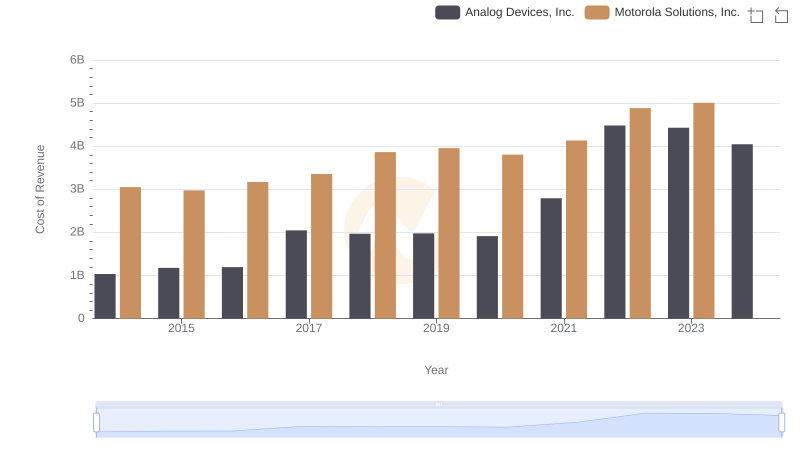
Cost of Revenue Comparison: Analog Devices, Inc. vs Motorola Solutions, Inc.
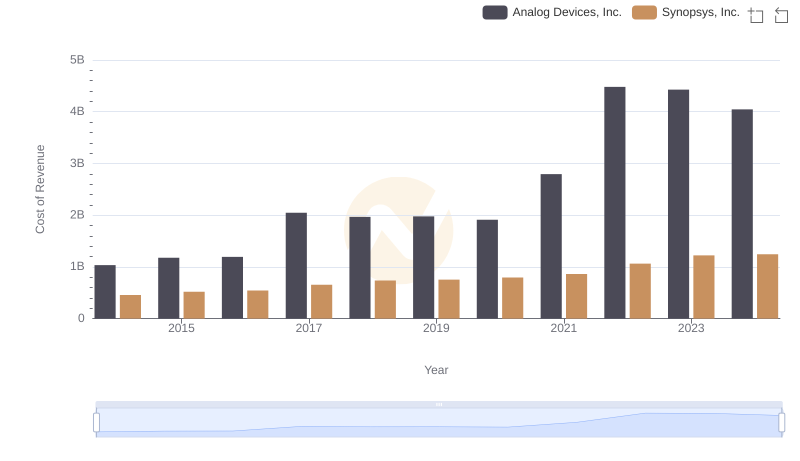
Analog Devices, Inc. vs Synopsys, Inc.: Efficiency in Cost of Revenue Explored
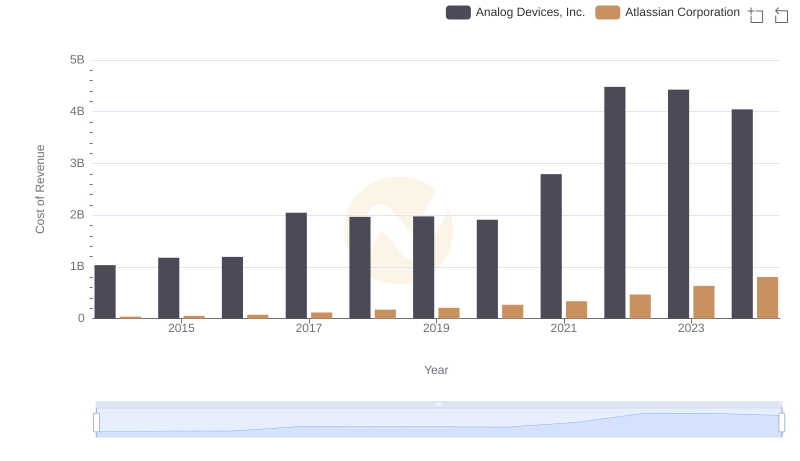
Cost Insights: Breaking Down Analog Devices, Inc. and Atlassian Corporation's Expenses
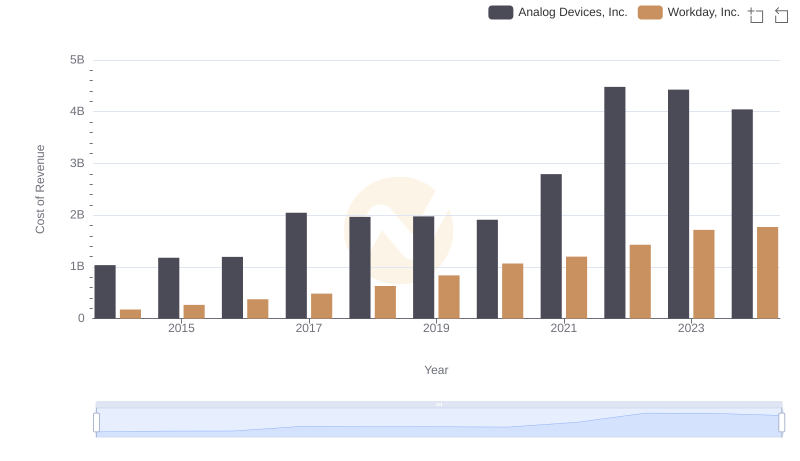
Comparing Cost of Revenue Efficiency: Analog Devices, Inc. vs Workday, Inc.
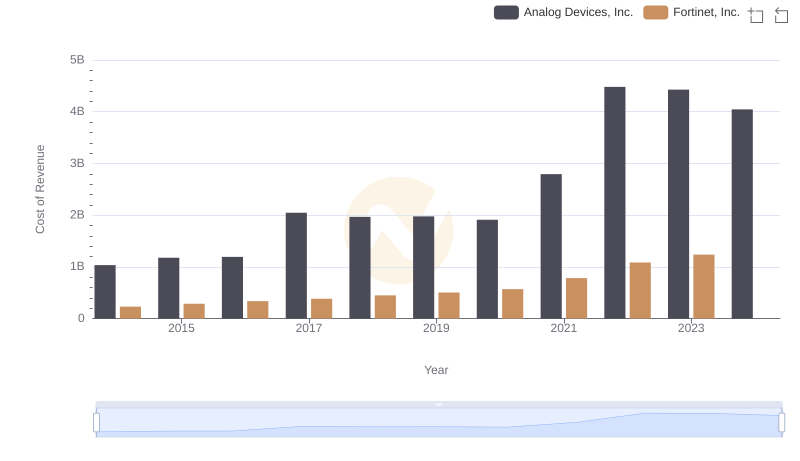
Cost of Revenue: Key Insights for Analog Devices, Inc. and Fortinet, Inc.
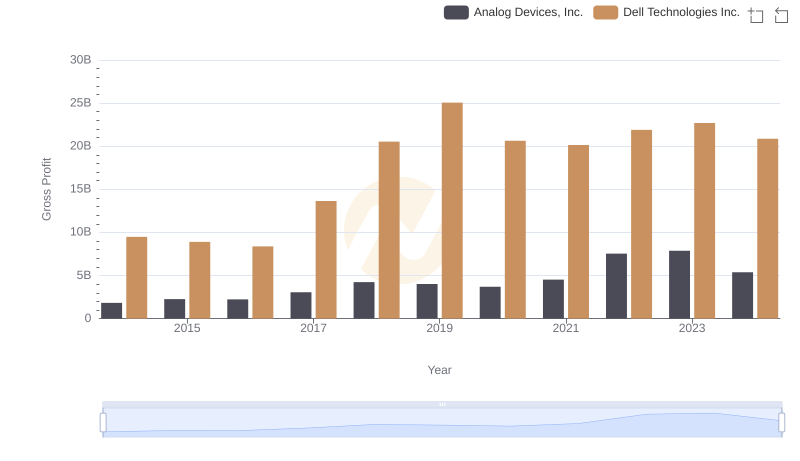
Gross Profit Comparison: Analog Devices, Inc. and Dell Technologies Inc. Trends
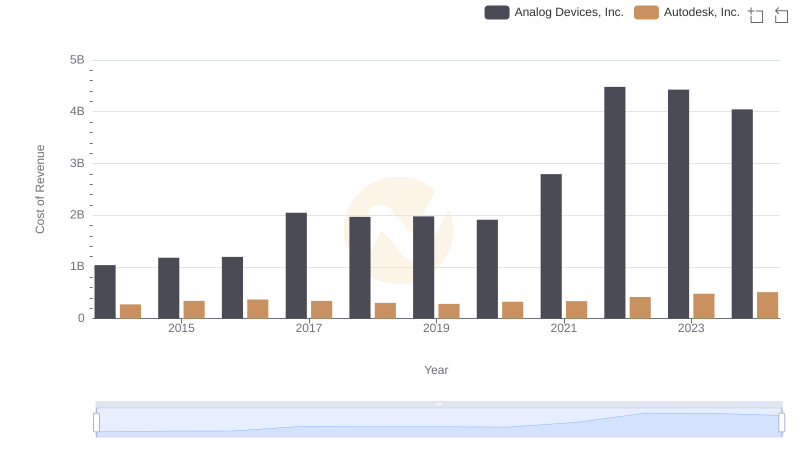
Analyzing Cost of Revenue: Analog Devices, Inc. and Autodesk, Inc.
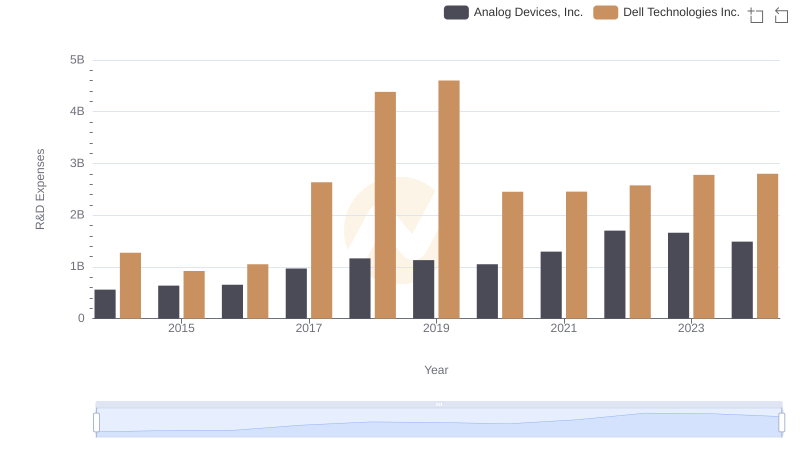
Research and Development: Comparing Key Metrics for Analog Devices, Inc. and Dell Technologies Inc.
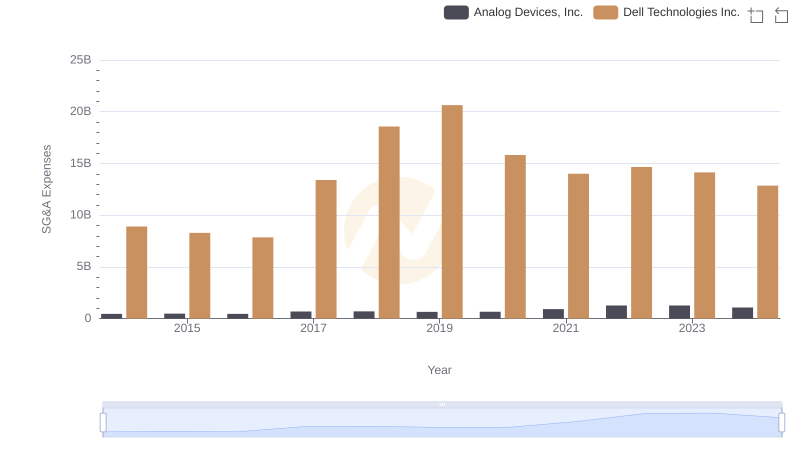
Breaking Down SG&A Expenses: Analog Devices, Inc. vs Dell Technologies Inc.
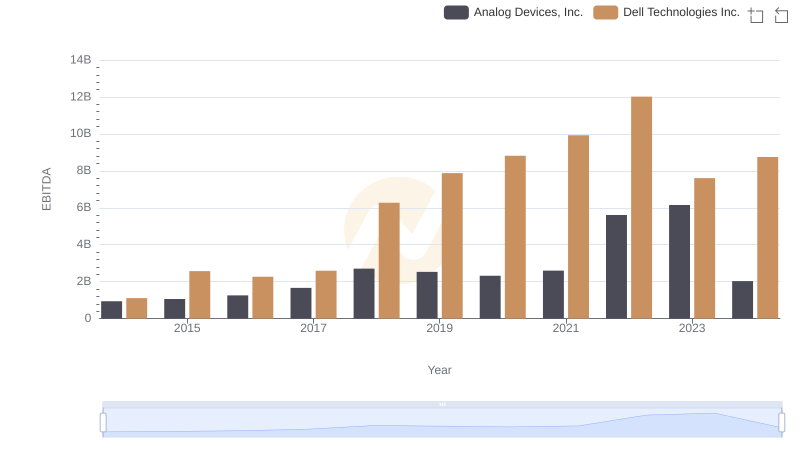
Analog Devices, Inc. vs Dell Technologies Inc.: In-Depth EBITDA Performance Comparison